Quickplot Help
Terminology
We need to distinguish between the two terms plot and graph.
In Quickplot a graph displays one or more plots.
Quickplot displays each graph in a page tab, like pages in
a web browser.
Quickplot can load data from: GUIs (graphical user interfaces), files listed
on the command line, and from standard input (pipes) too. Data
is loaded into channels. A channel represents a series of numbers,
like for example the values for one variable, or a column of numbers in
a spreadsheet. Other names for channel may be
dimension, coordinate, degree-of-freedom, field, or component.
We call them all channels in Quickplot.
Any two channels may be plotted against each other
whether they are from the same file or not.
A plot is a graphically representation of two channels, call them the X and Y
channels.
Any number of plots may be made on a graph.
The graph is like the paper we put the plots on.
Zooming
-
Grab Zooming Put the pointer (mouse) in the graph
window. Press the left mouse button and hold
it while dragging the graph by moving the pointer. Release the left
mouse button and the graph will stop moving with the pointer.
-
Zooming In Put the pointer (mouse) on a corner of a
graph region you want to zoom to. Press the right mouse button
and hold and drag the zoom box. Release the
right mouse button then it is at another corner of the zoom
region. Now Quickplot will zoom into that zoom region. You
can zoom in as many times as you like.
While holding the left mouse button
you can press the shift key or the control key while
pulling the zoom box to "shift" or "resize about the center"
respectively.
You can zoom to a view of smaller plots by just pressing and
releasing the right mouse button, without moving the pointer.
Do it again and the plots get even smaller.
You can do this any number of times.
-
Zooming Out Put the pointer (mouse) in the graph
window. Press the right mouse button and hold and drag the zoom
box. Release the right mouse button then it (the zoom box) is
past one edge of the graph window. Now Quickplot will zoom out to
the previous zoom level. Pressing the z key will do the same thing.
Or to zoom out to a full view (top zoom level) of the graph: put
the pointer (mouse) in the graph window. Press the right mouse
button and hold and drag the zoom box. Release the right mouse
button then the zoom box is past two edges (a corner) of the graph
window. Now Quickplot will zoom out to the top zoom level (no
zoom). Pressing Z (shift-z) will do the same thing.
Graph Value Picking
First open the Graph Details window by typing 'g', by using the
View menu, or by clicking the Graph Details button on the button bar.
Then select the "Plots List and Values" tab.
The middle mouse button is used for picking and
displaying X and Y values from the graph. Just try it and see.
There are three modes of number display value picking, which may
be selected on the top of the "Plots List and Values" page (tab):
- Pointer Values shows values where the mouse
pointer is in the scale of the respective plot
- Interpolate Plot Values shows values where the
X position of the mouse pointer is with the Y value displayed being a
linearly interpolated value.
This requires that all plots be functions of one particular channel.
- Pick Plot Point Values shows X and Y plot point
positions that are closest to mouse pointer X position.
This also requires that all plots be functions of one particular channel.
For the "Pointer Values" and "Interpolate Plot Values" modes the
number of significant digits displayed will vary with the value change
per pixel.
So you will not see digits that are not representative of the
mouse position.
Zooming will change the number of significant digits displayed.
Loadable File Formats
Quickplot can read ASCII text and sound files:
ASCII text
Quickplot can load ASCII text (plan
text) files. The number of values on each line need not be the same,
but any missing values will be filled with NAN.
Any number of non-number characters other than a new
line character may used to separate numbers on a given line.
NAN, INF, -NAN, -INF, +NAN, and +INF (lower case too) are numbers that
can be read by quickplot.
Any line starting with zero or more white space characters
and then any one of ! " # $ % & ' ( ) /
< = > ? @ C c is a comment line that
is ignored.
Any lines with no numbers that can be read will be ignored.
If you wish to have a break in a
plot line put a NAN (stands for not-a-number) in the channel
(column) at the point
(or non-point) where you wish to put the break at.
|
The interpretation of text as numbers depends on the standard C
libraries strtod() function which is locale dependent.
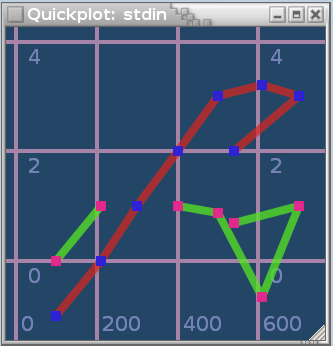
Example (from a typical USA locale):
| 1e2 | 0 | -1 |
| 2.1e2 | 1 | 0 |
| 3e2 | NAN | 1 |
| 4.01e2 | 1 | 2 |
| 5e2 | 0.87 | 3 |
| 6.1e2 | -0.65 | 3.2 |
| 7e2 | 1 | 3 |
| 5.4e2 | 0.7 | 2 |
|
|
|
Graph with two plots: column 1 versus column 0 and column 2 versus column
0.
Note that when Quickplot plots a point with a x or y value of NAN (or INF)
the point is skipped and there is not a connecting line to the
adjacent points.
|
|
|
In Austria (locale) it may look like:
| 1e2 | 0 | -1 |
| 2,1e2 | 1 | 0 |
| 3e2 | NAN | 1 |
| 4,01e2 | 1 | 2 |
| 5e2 | 0,87 | 3 |
| 6,1e2 | -0,65 | 3,2 |
| 7e2 | 1 | 3 |
| 5,4e2 | 0,7 | 2 |
|
The above example has three channels and eight samples (set of values) for each
channel. A file may have any counting number of channels, that's
1,2,3,4 or more channels.
With the use of NAN, as a kind of plot line terminator,
you can use Quickplot to draw figures composed of
straight line segments.
Here's a silly example.
Copy and paste the following command to draw this house:

|
echo -e "-10 8 -8 1 -1.5 -6\n-10 -6 -4 1 1.5 -6\n\
10 -6 -4 5 1.5 3\n10 8 -8 5 -1.5 3\nnan nan -8 1 -1.5 -6\n\
-13 8 nan nan\n13 8 4 1\n0 20 8 1\n-13 8 8 5\nnan nan 4 5\n\
nan nan 4 1" | quickplot -P --line-width=2 --no-grid \
--no-border --cairo-draw -C 'rgba(0,0,0,0)' --no-gui \
--no-points --geometry 79x87 -F -g "0 1 2 3 4 5"
|
Using NAN as a line terminator can be very handy when drawing
phase plots when you need to avoid connecting points that
should not be connected and you don't want to make more
channels (degrees of freedom).
For phase space plots the NAN can be thought of as a place
holder where you removed part of the series
because it is not accessible in the current model sampling.
If a file is loaded with a single channel
an additional channel, with the same number of values as the channel in
the file, will be added before the channel from the file.
Quickplot can read
CSV
files.
libsndfile sound file
Using the package libsndfile Quickplot can
read many sound file formats. An incomplete list of readable
sound file formats includes: Ogg/Vorbis,
Microsoft WAV, SGI/Apple AIFF/AIFC, and
Sun/DEC/NeXT AU/SND. See the libsndfile home-page
for a full list of supported sound file formats.
When loading a sound file the first channel (sequence) loaded will be
the time sequence, then each sound channel will follow in separate
channels.
Quickplot may be a little slow with sound files larger than thirty
seconds long. Thirty seconds of sound sampled at 44 kHz
with one channel would load 1.32 million data points.
Command Line Options
Usage: quickplot [OPTIONS]
Graphs will be generated for each file loaded, unless options are
given that tell Quickplot to do otherwise. The default number of
plots in a graph will be up to @NUMBER_OF_PLOTS@ plots or just the
number channels in the file minus one if that is less, unless options
override that. The default initial plots will be of all channels
except the first channel in the order that the channel was loaded from a
file plotted against the first channel in the file. A time channel
will be the first channel generated for all sound files loaded.
The order of argument options matters.
Options take effect in the order that
they are given with later options overriding
earlier ones.
The options that cause actions like graph "something" must
come after the option that says to read the file that has
"something" in it.
In general, the order of argument options gives
the order in which things happen as Quickplot starts up.
Short options, like -n20,
that require a sub-argument, may not be grouped with other short
options in one argument. For example the argument
-on20, is not valid, but -oN is a valid argument
with two options o (--no-points) and
N (--no-pipe), and -n20
is a valid option (--number-of-plots=20) that
sets the default number of plots to 20.
All of the command line options set things that can
be changed with the Quickplot graphical user interface (GUI).
For example, if you start with a graph with no lines and just points
showing, you can click a GUI to add the lines after the program
starts.
OPTIONS