1
2
3
4
5
6
7
8
9
10
11
12
13
14
15
16
17
18
19
20
21
22
23
24
25
26
27
28
29
30
31
32
33
34
35
36
37
38
39
40
41
42
43
44
45
46
47
48
49
50
51
52
53
54
55
56
57
58
59
60
61
62
63
64
65
66
67
68
69
70
71
72
73
74
75
76
77
78
79
80
81
82
83
84
85
86
87
88
89
90
91
92
93
94
95
96
97
98
99
100
101
102
103
104
105
106
107
108
109
110
111
112
113
114
115
116
117
118
119
120
121
122
123
124
125
126
127
128
129
130
131
132
133
134
135
136
137
138
139
140
141
142
143
144
145
146
147
148
149
150
151
152
153
154
155
156
157
158
159
160
161
162
163
164
165
166
167
168
169
170
171
172
173
174
175
176
177
178
179
180
181
182
183
184
185
186
187
188
189
190
191
192
193
194
195
196
197
198
199
200
201
202
203
204
205
206
207
208
209
210
211
212
213
214
215
216
217
218
219
220
221
222
223
224
225
226
227
228
229
230
231
232
233
234
235
236
237
238
239
|
# Memory Benchmarks
This document describes benchmarks available to track Chrome's and
WebView's memory usage, where they live, what they measure, how to run them,
and on how to diagnose regressions.
[TOC]
## Glossary
* **User story:** a set of actions to perform on a browser or device (e.g.
open google homepage, type "foo", click search, scroll down, visit first
result, etc.).
* **Metric:** a data aggregation process that takes a Chrome trace as input
(produced by a [Telemetry][] run) and produces a set of summary numbers as
output (e.g. total GPU memory used).
* **Benchmark:** a combination of (one or more) user stories and (one or
more) metrics.
[Telemetry]: https://github.com/catapult-project/catapult/blob/master/telemetry/README.md
## System Health
*System health* is an effort to unify top-level benchmarks (as opposite to
micro-benchmarks and regression tests) that are suitable to capture
representative user stories.
### Benchmarks
System health memory benchmarks are:
* [system_health.memory_mobile][system_health] -
user stories running on Android devices.
* [system_health.memory_desktop][system_health] -
user stories running on desktop platforms.
These benchmarks are run continuously on the [chromium.perf][] waterfall,
collecting and reporting results on the
[Chrome Performance Dashboard][chromeperf].
Other benchmarks maintained by the memory-infra team are discussed in the
[appendix](#Other-benchmarks).
[system_health]: https://chromium.googlesource.com/chromium/src/+/master/tools/perf/page_sets/system_health/
[chromium.perf]: https://build.chromium.org/p/chromium.perf/waterfall
[chromeperf]: https://chromeperf.appspot.com/report
### User stories
System health user stories are classified by the kind of interactions they
perform with the browser:
* `browse` stories navigate to a URL and interact with the page; e.g.
scroll, click on elements, navigate to subpages, navigate back.
* `load` stories just navigate to a URL and wait for the page to
load.
* `background` stories navigate to a URL, possibly interact with the
page, and then bring another app to the foreground (thus pushing the
browser to the background).
* `long_running` stories interact with a page for a longer period
of time (~5 mins).
* `blank` has a single story that just navigates to **about:blank**.
The full name of a story has the form `{interaction}:{category}:{site}` where:
* `interaction` is one the labels given above;
* `category` is used to group together sites with a similar purpose,
e.g. `news`, `social`, `tools`;
* `site` is a short name identifying the website in which the story mostly
takes place, e.g. `cnn`, `facebook`, `gmail`.
For example `browse:news:cnn` and `background:social:facebook` are two system
health user stories.
Today, for most stories a garbage collection is forced at the end of the
story and a memory dump is then triggered. Metrics report the values
obtained from this single measurement.
## Continuous monitoring
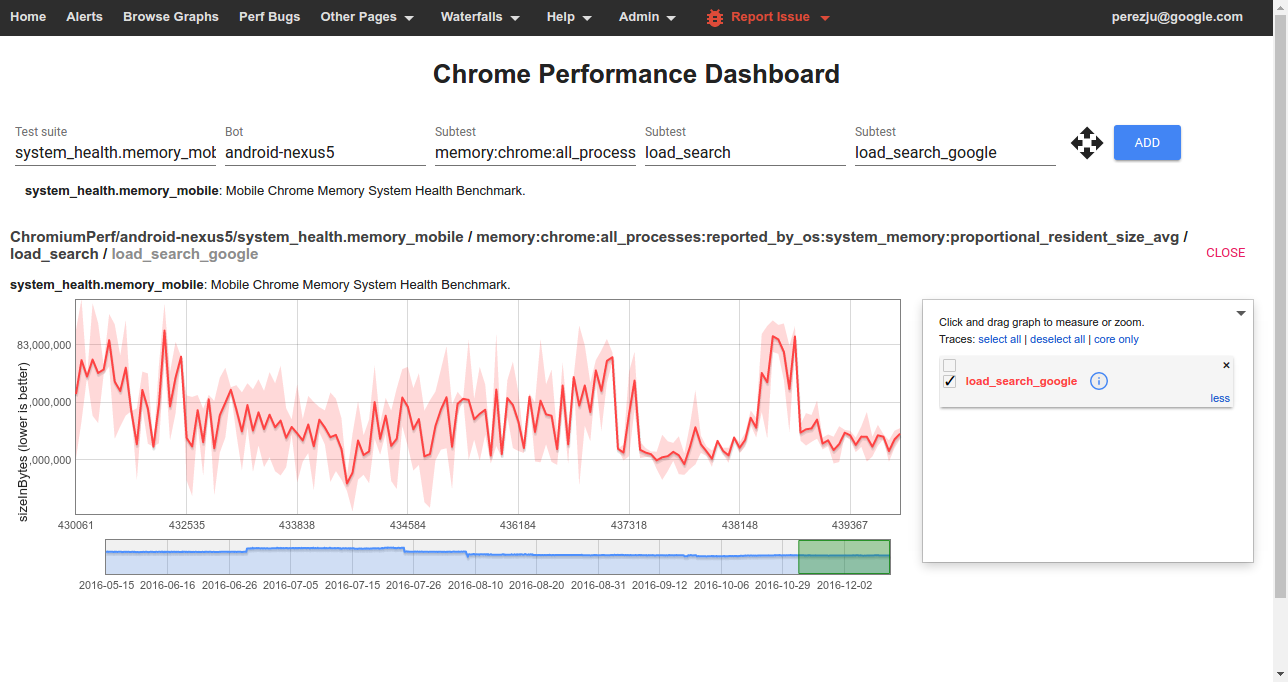
To view data from one of the benchmarks on the
[Chrome Performance Dashboard][chromeperf] you should select:
* **Test suite:** The name of a *[benchmark](#Benchmarks)*.
* **Bot:** The name of a *platform or device configuration*. Sign in to also
see internal bots.
* **Subtest (1):** The name of a *[metric](#Understanding-memory-metrics)*.
* **Subtest (2):** The name of a *story group*; these have the form
`{interaction}_{category}` for system health stories.
* **Subtest (3):** The name of a *[user story](#User-stories)*
(with `:` replaced by `_`).
## How to run the benchmarks
Benchmarks may be run on a local platform/device or remotely on a try job.
### How to run locally
After building, e.g. `ChromePublic.apk`, you can run a specific system health
story with the command:
```
$SRC/tools/perf/run_benchmark run system_health.memory_mobile \
--browser android-chromium --story-filter load:search:google
```
This will run the story with a default of 3 repetitions and produce a
`results.html` file comparing results from this and any previous benchmark
runs.
Other useful options for this command are:
* `--pageset-repeat [n]` - override the default number of repetitions
* `--output-format html --output-format json` - select *both* output formats
to get individual [trace files][memory-infra] in addition to the
`results.html` file.
* `--reset-results` - clear results from any previous benchmark runs in the
`results.html` file.
* `--results-label [label]` - give meaningful names to your benchmark runs,
this way it is easier to compare them.
For WebView make sure to [replace the system WebView][webview_install]
on your device and use `--browser android-webview`.
[webview_install]: https://www.chromium.org/developers/how-tos/build-instructions-android-webview
### How to run a try job
Given a patch on a chromium checkout, try jobs provide a convenient way to
evaluate its memory implications on devices or platforms which
may not be immediately available to developers.
To start a try job [upload a CL][contributing] and run the command, e.g.:
```
$SRC/tools/perf/run_benchmark try android-nexus5 system_health.memory_mobile
```
This will run all of the system health stories for you, and conveniently
provide a `results.html` file comparing measurements with/without your patch.
Options like `--story-filter` and `--pageset-repeat` may also be passed to
this command.
To see the full list of available try bots run the command:
```
$SRC/tools/perf/run_benchmark try list
```
[contributing]: https://www.chromium.org/developers/contributing-code
## Understanding memory metrics
There is a large number of [memory-infra][] metrics, breaking down usage
attributed to different components and processes.
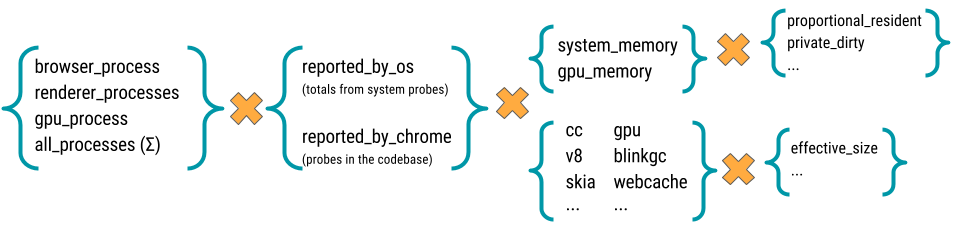
Most memory metrics have the form
`memory:{browser}:{processes}:{source}:{component}:{kind}`
where:
* **browser:** One of `chrome` or `webview`.
* **processess:** One of `browser_process`, `renderer_processess`,
`gpu_process`, or `all_processess`.
* **source:** One of `reported_by_chrome` or `reported_by_os`
* **component:** May be a Chrome component, e.g. `skia` or `sqlite`;
details about a specific component, e.g. `v8:heap`; or a class of memory
as seen by the OS, e.g. `system_memory:native_heap` or `gpu_memory`.
* **kind:** The kind of memory being reported. For metrics reported by
Chrome this usually is `effective_size` (others are `locked_size`
and `allocated_objects_size`); for metrics by the OS this usually is
`proportional_resident_size` (others are `peak_resident_size` and
`private_dirty_size`).
[memory-infra]: /memory-infra/README.md
## Appendix
There are a few other benchmarks maintained by the memory-infra team.
These also use the same set of metrics as system health, but have differences
on the kind of stories that they run.
### memory.top_10_mobile
The *top-10-mobile* benchmarks are in the process of being deprecated
in favor of system health benchmarks. This process, however, hasn't been
finalized and currently they are still the reference benchmark used for
decision making in the Android release process. Therefore, **it is important
to diagnose and fix regressions caught by these benchmarks**.
* [memory.top_10_mobile][memory_py] - Cycle between:
- load a page on Chrome, wait for it to load, [force garbage collection
and measure memory][measure];
- push Chrome to the background, force garbage collection and measure
memory again.
Repeat for each of 10 pages *without closing the browser*.
Close the browser, re-open and repeat the full page set a total of 5 times.
Story groups are either `foreground` or `background` depending on the state
of the browser at the time of measurement.
* [memory.top_10_mobile_stress][memory_py] - same as above, but keeps a single
instance of the browser open for the whole duration of the test and
*does not* force any garbage collection.
The main difference to watch out between these and system health benchmarks is
that, since a single browser instance is kept open and shared by many
individual stories, they are not independent of each other. In particular, **do
not use the `--story-filter` argument when trying to reproduce regressions**
on these benchmarks, as doing so will affect the results.
[measure]: https://github.com/catapult-project/catapult/blob/master/telemetry/telemetry/internal/actions/action_runner.py#L133
### Dual browser benchmarks
Dual browser benchmarks are intended to assess the memory implications of
shared resources between Chrome and WebView.
* [memory.dual_browser_test][memory_py] - cycle between doing Google searches
on a WebView-based browser (a stand-in for the Google Search app) and
loading pages on Chrome. Runs on Android devices only.
Story groups are either `on_chrome` or `on_webview`, indicating the browser
in foreground at the moment when the memory measurement was made.
* [memory.long_running_dual_browser_test][memory_py] - same as above, but the
test is run for 60 iterations keeping both browsers alive for the whole
duration of the test and without forcing garbage collection. Intended as a
last-resort net to catch memory leaks not apparent on shorter tests.
[memory_py]: https://chromium.googlesource.com/chromium/src/+/master/tools/perf/benchmarks/memory.py
|
