1
2
3
4
5
6
7
8
9
10
11
12
13
14
15
16
17
18
19
20
21
22
23
24
25
26
27
28
29
30
31
32
33
34
35
36
37
38
39
40
41
42
43
44
45
46
47
48
49
50
51
52
53
54
55
56
57
58
59
60
61
62
63
64
65
66
67
68
69
70
71
72
73
74
75
76
77
78
79
80
81
82
83
84
85
86
87
88
89
90
91
92
93
94
95
96
97
98
99
100
101
102
103
104
105
106
107
108
109
110
111
112
113
114
115
116
117
118
119
120
121
122
123
124
125
126
127
128
129
130
131
132
133
134
135
136
137
138
139
140
141
142
143
144
145
146
147
148
149
150
151
152
153
154
155
156
157
158
159
160
161
162
163
164
165
166
167
168
169
170
171
172
173
174
175
176
177
178
179
180
181
182
183
184
185
186
187
188
189
190
191
192
193
194
195
196
197
198
199
200
201
202
203
204
205
206
207
208
209
210
211
212
213
214
215
216
217
218
219
220
221
222
223
224
225
226
227
228
229
230
231
232
233
234
235
236
237
238
239
240
241
242
243
244
245
246
247
248
249
250
251
252
253
254
255
256
257
258
259
260
261
262
263
264
265
266
267
268
269
270
271
272
273
274
275
276
277
278
279
280
281
282
283
284
285
286
287
288
289
290
291
292
293
294
295
296
297
298
299
300
301
302
303
304
305
306
307
308
309
310
311
312
313
314
315
316
317
318
319
320
321
322
323
324
325
326
327
328
329
330
331
332
333
334
335
336
337
338
339
340
341
342
343
344
345
346
347
348
349
350
351
352
353
354
355
356
357
358
359
360
361
362
363
364
365
366
367
368
369
370
371
372
373
374
375
376
377
378
379
380
381
382
383
384
385
386
387
388
389
390
391
392
393
394
395
396
397
398
399
400
401
402
403
404
405
406
407
408
409
410
411
412
413
414
415
416
417
418
419
420
421
422
423
424
425
426
427
428
429
430
431
432
433
434
435
436
437
438
439
440
441
442
443
444
445
446
447
448
449
450
451
452
453
454
455
456
457
458
459
460
461
462
463
464
465
466
467
468
469
470
471
472
473
474
475
476
477
478
479
480
481
482
483
484
485
486
487
488
489
490
491
492
493
494
495
496
497
498
499
500
501
502
503
504
505
506
507
508
509
510
511
512
513
514
515
516
517
518
519
520
521
522
523
524
525
526
527
528
529
530
531
532
533
534
535
536
537
538
539
540
541
542
543
544
545
546
547
548
549
550
551
552
553
554
555
556
557
558
559
560
561
562
563
564
565
566
567
568
569
570
571
572
573
574
575
576
577
578
579
580
581
582
583
584
585
586
587
588
589
590
591
592
593
594
595
596
597
598
599
600
601
602
603
604
605
606
607
608
609
610
611
612
613
614
615
616
617
618
619
620
621
622
623
624
625
626
627
628
629
630
631
632
633
634
635
636
637
638
639
640
641
642
643
644
645
646
647
648
649
650
651
652
653
654
655
656
657
658
659
660
661
662
663
664
665
666
667
668
669
670
671
672
673
674
675
676
677
678
679
680
681
682
683
684
685
686
687
688
689
690
691
692
693
694
695
696
697
698
699
700
701
702
703
704
705
706
707
708
709
710
711
712
713
714
715
716
717
718
719
720
721
722
723
724
725
726
727
728
729
730
731
732
733
734
735
736
737
738
739
740
741
742
743
744
745
746
747
748
749
750
751
752
753
754
755
756
757
758
759
760
761
762
763
764
765
766
767
768
769
770
771
772
773
774
775
776
777
778
779
780
781
782
783
784
785
786
787
788
789
790
791
792
793
794
795
796
797
798
799
800
801
802
803
804
805
806
807
808
809
810
811
812
813
814
815
816
817
818
819
820
821
822
823
824
825
826
827
828
829
830
831
832
833
834
835
836
837
838
839
840
841
842
843
844
845
846
847
848
849
850
851
852
853
854
855
856
857
858
859
860
861
862
863
864
865
866
867
868
869
870
871
872
873
874
875
876
877
878
879
880
881
882
883
884
885
886
887
888
889
890
891
892
893
894
895
896
897
898
899
900
901
902
903
904
905
906
907
908
909
910
911
912
913
914
915
916
917
918
919
920
921
922
923
924
925
926
927
928
929
930
931
932
933
934
935
936
937
938
939
940
941
942
943
944
945
946
947
948
949
950
951
952
953
954
955
956
957
958
959
960
961
962
963
964
965
966
967
968
969
970
971
972
973
974
975
976
977
978
979
980
981
982
983
984
985
986
987
988
989
990
991
992
993
994
995
996
997
998
999
1000
1001
1002
1003
1004
1005
1006
1007
1008
1009
1010
1011
1012
1013
1014
1015
1016
1017
1018
1019
1020
1021
1022
1023
1024
1025
1026
1027
1028
1029
1030
1031
1032
1033
1034
1035
1036
1037
1038
1039
1040
1041
1042
1043
1044
1045
1046
1047
1048
1049
1050
1051
1052
1053
1054
1055
1056
1057
1058
1059
1060
1061
1062
1063
1064
1065
1066
1067
1068
1069
1070
1071
1072
1073
1074
1075
1076
1077
1078
1079
1080
1081
1082
1083
1084
1085
1086
1087
1088
1089
1090
1091
1092
1093
1094
1095
1096
1097
1098
1099
1100
1101
1102
1103
1104
1105
1106
1107
1108
1109
1110
1111
1112
1113
1114
1115
1116
1117
1118
1119
1120
1121
1122
1123
1124
1125
1126
1127
1128
1129
1130
1131
1132
1133
1134
1135
1136
1137
1138
1139
1140
1141
1142
1143
1144
1145
1146
1147
1148
1149
1150
1151
1152
1153
1154
1155
1156
1157
1158
1159
1160
1161
1162
1163
1164
1165
1166
1167
1168
1169
1170
1171
1172
1173
1174
1175
1176
1177
1178
1179
1180
1181
1182
1183
1184
1185
1186
1187
1188
1189
1190
1191
1192
1193
1194
1195
1196
1197
1198
1199
1200
1201
1202
1203
1204
1205
1206
1207
1208
1209
1210
1211
1212
1213
1214
1215
1216
1217
1218
1219
1220
1221
1222
1223
1224
1225
1226
1227
1228
1229
1230
1231
1232
1233
1234
1235
1236
1237
1238
1239
1240
1241
1242
1243
1244
1245
1246
1247
1248
1249
1250
1251
1252
1253
1254
1255
1256
1257
1258
1259
1260
1261
1262
1263
1264
1265
1266
1267
1268
1269
1270
1271
1272
1273
1274
1275
1276
1277
1278
1279
1280
1281
1282
1283
1284
1285
1286
1287
1288
1289
1290
1291
1292
1293
1294
1295
1296
1297
1298
1299
1300
1301
1302
1303
1304
1305
1306
1307
1308
1309
1310
1311
1312
1313
1314
1315
1316
1317
1318
1319
1320
1321
1322
1323
1324
1325
1326
1327
1328
1329
1330
1331
1332
1333
1334
1335
1336
1337
1338
1339
1340
1341
1342
1343
1344
1345
1346
1347
1348
1349
1350
1351
1352
1353
1354
1355
1356
1357
1358
1359
1360
1361
1362
1363
1364
1365
1366
1367
1368
1369
1370
1371
1372
1373
1374
1375
1376
1377
1378
1379
1380
1381
1382
1383
1384
1385
1386
1387
1388
1389
1390
1391
1392
1393
1394
1395
1396
1397
1398
1399
1400
1401
1402
1403
1404
1405
1406
1407
1408
1409
1410
1411
1412
1413
1414
1415
1416
1417
1418
1419
1420
1421
1422
1423
1424
1425
1426
1427
1428
1429
1430
1431
1432
1433
1434
1435
1436
1437
1438
1439
1440
1441
1442
1443
1444
1445
1446
1447
1448
1449
1450
1451
1452
1453
1454
1455
1456
1457
1458
1459
1460
1461
1462
1463
1464
1465
1466
1467
1468
1469
1470
1471
1472
1473
1474
1475
1476
1477
1478
1479
1480
1481
1482
1483
1484
1485
1486
1487
1488
1489
1490
1491
1492
1493
1494
1495
1496
1497
1498
1499
1500
1501
1502
1503
1504
1505
1506
1507
1508
1509
1510
1511
1512
1513
1514
1515
1516
1517
1518
1519
1520
1521
1522
1523
1524
1525
1526
1527
1528
1529
1530
1531
1532
1533
1534
1535
1536
1537
1538
1539
1540
1541
1542
1543
1544
1545
1546
1547
1548
1549
1550
1551
1552
1553
1554
1555
1556
1557
1558
1559
1560
1561
1562
1563
1564
1565
1566
1567
1568
1569
1570
1571
1572
1573
1574
1575
1576
1577
1578
1579
1580
1581
1582
1583
1584
1585
1586
1587
1588
1589
1590
1591
1592
1593
1594
1595
1596
1597
1598
1599
1600
1601
1602
1603
1604
1605
1606
1607
1608
1609
1610
1611
1612
1613
1614
1615
1616
1617
1618
1619
1620
1621
1622
1623
1624
1625
1626
1627
1628
1629
1630
1631
1632
1633
1634
1635
1636
1637
1638
1639
1640
1641
1642
1643
1644
1645
1646
1647
1648
1649
1650
1651
1652
1653
1654
1655
1656
1657
1658
1659
1660
1661
1662
1663
1664
1665
1666
1667
1668
1669
1670
1671
1672
1673
1674
1675
1676
1677
1678
1679
1680
1681
1682
1683
1684
1685
1686
1687
1688
1689
1690
1691
1692
1693
1694
1695
1696
1697
1698
1699
1700
1701
1702
1703
1704
1705
1706
1707
1708
1709
1710
1711
1712
1713
1714
1715
1716
1717
1718
1719
1720
1721
1722
1723
1724
1725
1726
1727
1728
1729
1730
1731
1732
1733
1734
1735
1736
1737
1738
1739
1740
1741
1742
1743
1744
1745
1746
1747
1748
1749
1750
1751
1752
1753
1754
1755
1756
1757
1758
1759
1760
1761
1762
1763
1764
1765
1766
1767
1768
1769
1770
1771
1772
|
# Cpptrace <!-- omit in toc -->
[](https://github.com/jeremy-rifkin/cpptrace/actions/workflows/ci.yml)
[](https://sonarcloud.io/summary/new_code?id=jeremy-rifkin_cpptrace)
<br/>
[-Community%20Discord-blue?labelColor=2C3239&color=7289DA&style=flat&logo=discord&logoColor=959DA5)](https://discord.gg/frjaAZvqUZ)
<br/>
[](https://godbolt.org/z/aP8PsxxeY)
Cpptrace is a simple and portable C++ stacktrace library supporting C++11 and greater on Linux, macOS, and Windows
including MinGW and Cygwin environments. The goal: Make stack traces simple for once.
In addition to providing access to stack traces, cpptrace also provides a mechanism for getting stacktraces from thrown
exceptions which is immensely valuable for debugging and triaging. More info [below](#traces-from-all-exceptions-cpptrace_try-and-cpptrace_catch).
Cpptrace also has a C API, docs [here](docs/c-api.md).
## Table of Contents <!-- omit in toc -->
- [30-Second Overview](#30-second-overview)
- [CMake FetchContent Usage](#cmake-fetchcontent-usage)
- [Prerequisites](#prerequisites)
- [Basic Usage](#basic-usage)
- [`namespace cpptrace`](#namespace-cpptrace)
- [Stack Traces](#stack-traces)
- [Object Traces](#object-traces)
- [Raw Traces](#raw-traces)
- [Utilities](#utilities)
- [Formatting](#formatting)
- [Transforms](#transforms)
- [Configuration](#configuration)
- [Logging](#logging)
- [Traces From All Exceptions (`CPPTRACE_TRY` and `CPPTRACE_CATCH`)](#traces-from-all-exceptions-cpptrace_try-and-cpptrace_catch)
- [Removing the `CPPTRACE_` prefix](#removing-the-cpptrace_-prefix)
- [How it works](#how-it-works)
- [Performance](#performance)
- [Rethrowing Exceptions](#rethrowing-exceptions)
- [`cpptrace::try_catch`](#cpptracetry_catch)
- [Traces from SEH exceptions](#traces-from-seh-exceptions)
- [Traced Exception Objects](#traced-exception-objects)
- [Wrapping std::exceptions](#wrapping-stdexceptions)
- [Exception handling with cpptrace exception objects](#exception-handling-with-cpptrace-exception-objects)
- [Terminate Handling](#terminate-handling)
- [Signal-Safe Tracing](#signal-safe-tracing)
- [Utility Types](#utility-types)
- [Headers](#headers)
- [Libdwarf Tuning](#libdwarf-tuning)
- [JIT Support](#jit-support)
- [Loading Libraries at Runtime](#loading-libraries-at-runtime)
- [ABI Versioning](#abi-versioning)
- [Supported Debug Formats](#supported-debug-formats)
- [How to Include The Library](#how-to-include-the-library)
- [CMake FetchContent](#cmake-fetchcontent)
- [System-Wide Installation](#system-wide-installation)
- [Local User Installation](#local-user-installation)
- [Use Without CMake](#use-without-cmake)
- [Installation Without Package Managers or FetchContent](#installation-without-package-managers-or-fetchcontent)
- [Package Managers](#package-managers)
- [Conan](#conan)
- [Vcpkg](#vcpkg)
- [C++20 Modules](#c20-modules)
- [Platform Logistics](#platform-logistics)
- [Windows](#windows)
- [macOS](#macos)
- [Library Back-Ends](#library-back-ends)
- [Summary of Library Configurations](#summary-of-library-configurations)
- [Testing Methodology](#testing-methodology)
- [Notes About the Library](#notes-about-the-library)
- [FAQ](#faq)
- [What about C++23 `<stacktrace>`?](#what-about-c23-stacktrace)
- [What does cpptrace have over other C++ stacktrace libraries?](#what-does-cpptrace-have-over-other-c-stacktrace-libraries)
- [I'm getting undefined standard library symbols like `std::__1::basic_string` on MacOS](#im-getting-undefined-standard-library-symbols-like-std__1basic_string-on-macos)
- [Contributing](#contributing)
- [License](#license)
# 30-Second Overview
Generating stack traces is as easy as:
```cpp
#include <cpptrace/cpptrace.hpp>
void trace() {
cpptrace::generate_trace().print();
}
```
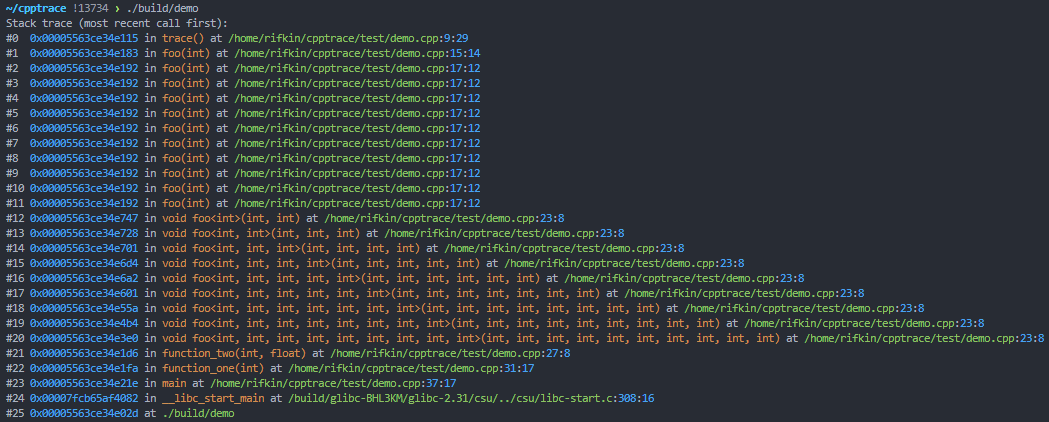
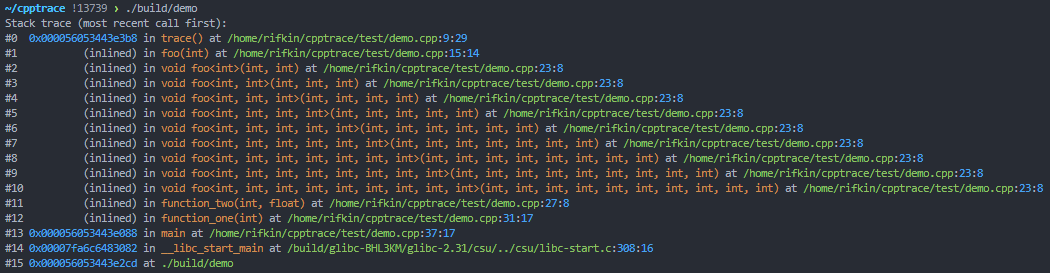
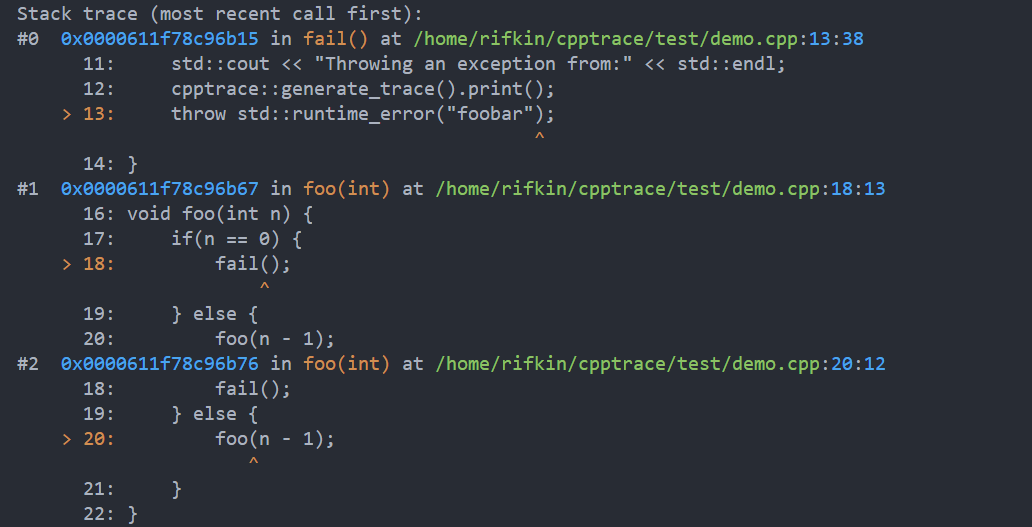
Cpptrace can also retrieve function inlining information on optimized release builds:
Cpptrace provides access to resolved stack traces as well as fast and lightweight raw traces (just addresses) that can
be resolved later:
```cpp
const auto raw_trace = cpptrace::generate_raw_trace();
// then later
raw_trace.resolve().print();
```
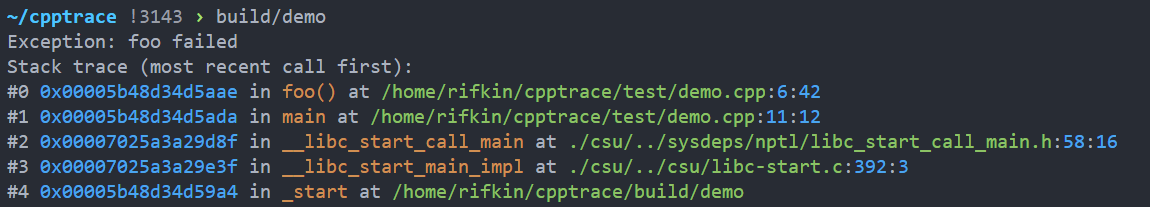
One of the most important features cpptrace offers is the ability to retrieve stack traces on arbitrary exceptions.
More information on this system [below]((#traces-from-all-exceptions-cpptrace_try-and-cpptrace_catch)).
```cpp
#include <cpptrace/from_current.hpp>
#include <iostream>
#include <stdexcept>
void foo() {
throw std::runtime_error("foo failed");
}
int main() {
CPPTRACE_TRY {
foo();
} CPPTRACE_CATCH(const std::exception& e) {
std::cerr<<"Exception: "<<e.what()<<std::endl;
cpptrace::from_current_exception().print();
}
}
```
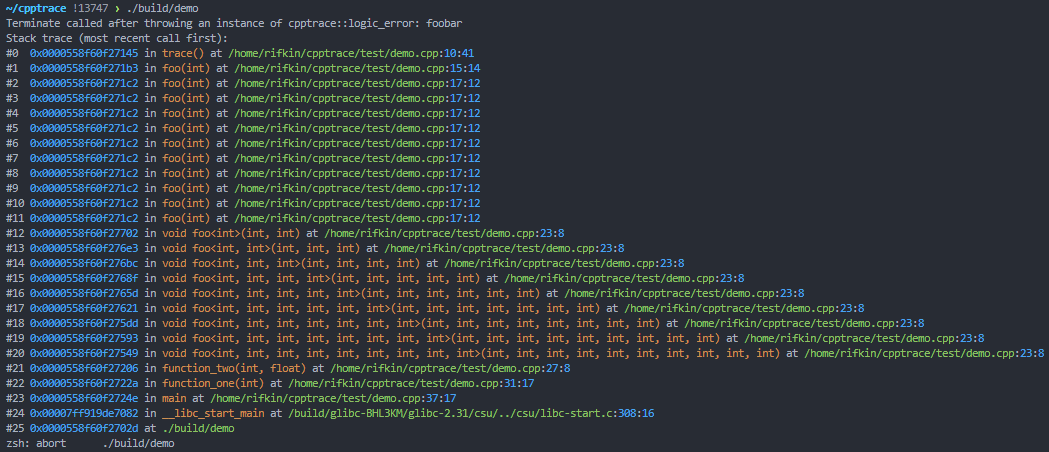
Cpptrace also provides a handful of traced exception objects that store stack traces when thrown. This is useful when
the exceptions might not be caught by `CPPTRACE_CATCH`:
```cpp
#include <cpptrace/cpptrace.hpp>
void trace() {
throw cpptrace::logic_error("This wasn't supposed to happen!");
}
```
Additional notable features:
- Utilities for demangling
- Utilities for catching `std::exception`s and wrapping them in traced exceptions
- Signal-safe stack tracing
- As far as I can tell cpptrace is the only library which can truly do this in a signal-safe manner
- Source code snippets in traces
- Extensive configuration options for [trace formatting](#formatting) and pretty-printing
## CMake FetchContent Usage
```cmake
include(FetchContent)
FetchContent_Declare(
cpptrace
GIT_REPOSITORY https://github.com/jeremy-rifkin/cpptrace.git
GIT_TAG v1.0.4 # <HASH or TAG>
)
FetchContent_MakeAvailable(cpptrace)
target_link_libraries(your_target cpptrace::cpptrace)
# Needed for shared library builds on windows: copy cpptrace.dll to the same directory as the
# executable for your_target
if(WIN32)
add_custom_command(
TARGET your_target POST_BUILD
COMMAND ${CMAKE_COMMAND} -E copy_if_different
$<TARGET_FILE:cpptrace::cpptrace>
$<TARGET_FILE_DIR:your_target>
)
endif()
```
Be sure to configure with `-DCMAKE_BUILD_TYPE=Debug` or `-DCMAKE_BUILD_TYPE=RelWithDebInfo` for symbols and line
information.
On macOS it is recommended to generate a `.dSYM` file, see [Platform Logistics](#platform-logistics) below.
For other ways to use the library, such as through package managers, a system-wide installation, or on a platform
without internet access see [How to Include The Library](#how-to-include-the-library) below.
# Prerequisites
> [!IMPORTANT]
> Debug info (`-g`/`/Z7`/`/Zi`/`/DEBUG`/`-DBUILD_TYPE=Debug`/`-DBUILD_TYPE=RelWithDebInfo`) is required for complete
> trace information.
# Basic Usage
`cpptrace::generate_trace()` can be used to generate a `stacktrace` object at the current call site. Resolved frames can
be accessed from this object with `.frames` and the trace can be printed with `.print()`. Cpptrace also provides a
method to get light-weight raw traces with `cpptrace::generate_raw_trace()`, which are just vectors of program counters,
which can be resolved at a later time.
# `namespace cpptrace`
All functions are thread-safe unless otherwise noted.
## Stack Traces
The core resolved stack trace object. Generate a trace with `cpptrace::generate_trace()` or
`cpptrace::stacktrace::current()`. On top of a set of helper functions `struct stacktrace` allows
direct access to frames as well as iterators.
`cpptrace::stacktrace::print` can be used to print a stacktrace. `cpptrace::stacktrace::print_with_snippets` can be used
to print a stack trace with source code snippets.
```cpp
namespace cpptrace {
// Some type sufficient for an instruction pointer, currently always an alias to std::uintptr_t
using frame_ptr = std::uintptr_t;
struct stacktrace_frame {
frame_ptr raw_address; // address in memory
frame_ptr object_address; // address in the object file
// nullable<T> represents a nullable integer. More docs later.
nullable<std::uint32_t> line;
nullable<std::uint32_t> column;
std::string filename;
std::string symbol;
bool is_inline;
bool operator==(const stacktrace_frame& other) const;
bool operator!=(const stacktrace_frame& other) const;
object_frame get_object_info() const; // object_address is stored but if the object_path is needed this can be used
std::string to_string() const;
/* operator<<(ostream, ..) and std::format support exist for this object */
};
struct stacktrace {
std::vector<stacktrace_frame> frames;
// here as a drop-in for std::stacktrace
static stacktrace current(std::size_t skip = 0);
static stacktrace current(std::size_t skip, std::size_t max_depth);
void print() const;
void print(std::ostream& stream) const;
void print(std::ostream& stream, bool color) const;
void print_with_snippets() const;
void print_with_snippets(std::ostream& stream) const;
void print_with_snippets(std::ostream& stream, bool color) const;
std::string to_string(bool color = false) const;
void clear();
bool empty() const noexcept;
/* operator<<(ostream, ..), std::format support, and iterators exist for this object */
};
stacktrace generate_trace(std::size_t skip = 0);
stacktrace generate_trace(std::size_t skip, std::size_t max_depth);
}
```
## Object Traces
Object traces contain the most basic information needed to construct a stack trace outside the currently running
executable. It contains the raw address, the address in the binary (ASLR and the object file's memory space and whatnot
is resolved), and the path to the object the instruction pointer is located in.
```cpp
namespace cpptrace {
struct object_frame {
std::string object_path;
frame_ptr raw_address;
frame_ptr object_address;
};
struct object_trace {
std::vector<object_frame> frames;
static object_trace current(std::size_t skip = 0);
static object_trace current(std::size_t skip, std::size_t max_depth);
stacktrace resolve() const;
void clear();
bool empty() const noexcept;
/* iterators exist for this object */
};
object_trace generate_object_trace(std::size_t skip = 0);
object_trace generate_object_trace(std::size_t skip, std::size_t max_depth);
}
```
## Raw Traces
Raw trace access: A vector of program counters. These are ideal for fast and cheap traces you want to resolve later.
Note it is important executables and shared libraries in memory aren't somehow unmapped otherwise libdl calls (and
`GetModuleFileName` in windows) will fail to figure out where the program counter corresponds to.
```cpp
namespace cpptrace {
struct raw_trace {
std::vector<frame_ptr> frames;
static raw_trace current(std::size_t skip = 0);
static raw_trace current(std::size_t skip, std::size_t max_depth);
object_trace resolve_object_trace() const;
stacktrace resolve() const;
void clear();
bool empty() const noexcept;
/* iterators exist for this object */
};
raw_trace generate_raw_trace(std::size_t skip = 0);
raw_trace generate_raw_trace(std::size_t skip, std::size_t max_depth);
}
```
## Utilities
`cpptrace::demangle` is a helper function for name demangling, since it has to implement that helper internally anyways.
`cpptrace::basename` is a helper for custom formatters that extracts a base file name from a path.
`cpptrace::prettify_symbol` is a helper for custom formatters that applies a number of transformations to clean up long
symbol names. For example, it turns `std::__cxx11::basic_string<char, std::char_traits<char>, std::allocator<char> >`
into `std::string`.
`cpptrace::prune_symbol` is a helper for custom formatters that prunes demangled symbols by removing return types,
template arguments, and function parameters. It also does some minimal normalization. For example, it prunes
`ns::S<int, float>::~S()` to `ns::S::~S`. If cpptrace is unable to parse the symbol it will return the original symbol.
`cpptrace::get_snippet` gets a text snippet, if possible, from for the given source file for +/- `context_size` lines
around `line`.
`cpptrace::isatty` and the fileno definitions are useful for deciding whether to use color when printing stack traces.
`cpptrace::register_terminate_handler()` is a helper function to set a custom `std::terminate` handler that prints a
stack trace from a cpptrace exception (more info below) and otherwise behaves like the normal terminate handler.
```cpp
namespace cpptrace {
std::string demangle(const std::string& name);
std::string basename(const std::string& path);
std::string prettify_symbol(std::string symbol);
std::string prune_symbol(const std::string& symbol);
std::string get_snippet(
const std::string& path,
std::size_t line,
std::size_t context_size,
bool color = false
);
std::string get_snippet(
const std::string& path,
std::size_t line,
nullable<std::uint32_t> column,
std::size_t context_size,
bool color = false
);
bool isatty(int fd);
extern const int stdin_fileno;
extern const int stderr_fileno;
extern const int stdout_fileno;
void register_terminate_handler();
}
```
## Formatting
Cpptrace provides a configurable formatter for stack trace printing which supports some common options. Formatters are
configured with a sort of builder pattern, e.g.:
```cpp
auto formatter = cpptrace::formatter{}
.header("Stack trace:")
.addresses(cpptrace::formatter::address_mode::object)
.snippets(true);
```
This API is available through the `<cpptrace/formatting.hpp>` header.
Synopsis:
```cpp
namespace cpptrace {
class formatter {
formatter& header(std::string);
enum class color_mode { always, none, automatic };
formatter& colors(color_mode);
enum class address_mode { raw, object, none };
formatter& addresses(address_mode);
enum class path_mode { full, basename };
formatter& paths(path_mode);
formatter& snippets(bool);
formatter& snippet_context(int);
formatter& columns(bool);
enum class symbol_mode { full, pretty, pruned };
formatter& symbols(symbol_mode);
formatter& filtered_frame_placeholders(bool);
formatter& filter(std::function<bool(const stacktrace_frame&)>);
formatter& transform(std::function<stacktrace_frame(stacktrace_frame)>);
formatter& break_before_filename(bool do_break = true);
formatter& hide_exception_machinery(bool do_hide = true);
std::string format(const stacktrace_frame&) const;
std::string format(const stacktrace_frame&, bool color) const;
std::string format(const stacktrace&) const;
std::string format(const stacktrace&, bool color) const;
void print(const stacktrace_frame&) const;
void print(const stacktrace_frame&, bool color) const;
void print(std::ostream&, const stacktrace_frame&) const;
void print(std::ostream&, const stacktrace_frame&, bool color) const;
void print(std::FILE*, const stacktrace_frame&) const;
void print(std::FILE*, const stacktrace_frame&, bool color) const;
void print(const stacktrace&) const;
void print(const stacktrace&, bool color) const;
void print(std::ostream&, const stacktrace&) const;
void print(std::ostream&, const stacktrace&, bool color) const;
void print(std::FILE*, const stacktrace&) const;
void print(std::FILE*, const stacktrace&, bool color) const;
};
}
```
Options:
| Setting | Description | Default |
| ----------------------------- | ------------------------------------------------------------------ | ------------------------------------------------------------------------ |
| `header` | Header line printed before the trace | `Stack trace (most recent call first):` |
| `colors` | Default color mode for the trace | `automatic`, which attempts to detect if the target stream is a terminal |
| `addresses` | Raw addresses, object addresses, or no addresses | `raw` |
| `paths` | Full paths or just filenames | `full` |
| `snippets` | Whether to include source code snippets | `false` |
| `snippet_context` | How many lines of source context to show in a snippet | `2` |
| `columns` | Whether to include column numbers if present | `true` |
| `symbols` | Full demangled symbols, pruned symbol names, or prettified symbols | `full` |
| `filtered_frame_placeholders` | Whether to still print filtered frames as just `#n (filtered)` | `true` |
| `filter` | A predicate to filter frames with | None |
| `transform` | A transformer which takes a stacktrace frame and modifies it | None |
| `break_before_filename` | Print symbol and line source location on different lines | `false` |
| `hide_exception_machinery` | Hide exception internals for current exception traces | `true` |
The `automatic` color mode attempts to detect if a stream that may be attached to a terminal. As such, it will not use
colors for the `formatter::format` method and it may not be able to detect if some ostreams correspond to terminals or
not. For this reason, `formatter::format` and `formatter::print` methods have overloads taking a color parameter. This
color parameter will override configured color mode.
The `symbols` option provides a few settings for pretty-printing symbol names:
- `symbol_mode::full` default, uses the full demangled name
- `symbol_mode::pretty` applies a number of transformations to clean up long symbol names. For example, it turns
`std::__cxx11::basic_string<char, std::char_traits<char>, std::allocator<char> >` into `std::string`. This is
equivalent to `cpptrace::prettify_symbol`.
- `symbol_mode::pruned` prunes demangled symbols by removing return types, template arguments, and function parameters.
It also does some minimal normalization. For example, it prunes `ns::S<int, float>::~S()` to `ns::S::~S`. If cpptrace
is unable to parse the symbol it will use the full symbol. This is equivalent to `cpptrace::prune_symbol`.
Recommended practice with formatters: It's generally preferable to create formatters objects that are long-lived rather
than to create them on the fly every time a trace needs to be formatted.
Cpptrace provides access to a formatter with default settings with `get_default_formatter`:
```cpp
namespace cpptrace {
const formatter& get_default_formatter();
}
```
### Transforms
A transform function can be specified for the formatter. This function is called before the configured `filter` is
checked. For example:
```cpp
auto formatter = cpptrace::formatter{}
.transform([](cpptrace::stacktrace_frame frame) {
frame.symbol = replace_all(frame, "std::__cxx11::", "std::");
return frame;
});
```
## Configuration
`cpptrace::absorb_trace_exceptions`: Configure whether the library silently absorbs internal exceptions and continues.
Default is true.
`cpptrace::enable_inlined_call_resolution`: Configure whether the library will attempt to resolve inlined call
information for release builds. Default is true.
`cpptrace::experimental::set_cache_mode`: Control time-memory tradeoffs within the library. By default speed is
prioritized. If using this function, set the cache mode at the very start of your program before any traces are
performed.
```cpp
namespace cpptrace {
void absorb_trace_exceptions(bool absorb);
void enable_inlined_call_resolution(bool enable);
enum class cache_mode {
// Only minimal lookup tables
prioritize_memory,
// Build lookup tables but don't keep them around between trace calls
hybrid,
// Build lookup tables as needed
prioritize_speed
};
namespace experimental {
void set_cache_mode(cache_mode mode);
}
}
```
### Logging
Cpptrace attempts to gracefully recover from any internal errors in order to provide the best information it can and not
interfere with user applications. However, sometimes it's important to see what's going wrong inside cpptrace if
anything does go wrong. To facilitate this, cpptrace has an internal logger. By default it doesn't log anything out. The
following configurations that can be used to set a custom logging callback or enable logging to stderr:
```cpp
namespace cpptrace {
enum class log_level { debug, info, warning, error };
void set_log_level(log_level level);
void set_log_callback(std::function<void(log_level, const char*)>);
void use_default_stderr_logger();
}
```
`cpptrace::set_log_level`: Set cpptrace's internal log level. Default: `error`. Cpptrace currently only uses this log
level internally.
`cpptrace::set_log_callback`: Set the callback cpptrace uses for logging messages, useful for custom loggers.
`cpptrace::use_default_stderr_logger`: Set's the logging callback to print to stderr.
## Traces From All Exceptions (`CPPTRACE_TRY` and `CPPTRACE_CATCH`)
Cpptrace provides `CPPTRACE_TRY` and `CPPTRACE_CATCH` macros that allow a stack trace to be collected from the current
thrown exception object, with no overhead in the non-throwing (happy) path:
```cpp
#include <cpptrace/from_current.hpp>
#include <iostream>
void foo() {
throw std::runtime_error("foo failed");
}
int main() {
CPPTRACE_TRY {
foo();
} CPPTRACE_CATCH(const std::exception& e) {
std::cerr<<"Exception: "<<e.what()<<std::endl;
cpptrace::from_current_exception().print();
}
}
```
This functionality is entirely opt-in, to access this use `#include <cpptrace/from_current.hpp>`.
Any declarator `catch` accepts works with `CPPTRACE_CATCH`, including `...`. This works with any thrown object, not just
`std::exceptions`. It even works with `throw 0;`!

API functions:
- `cpptrace::raw_trace_from_current_exception`: Returns `const raw_trace&` from the current exception.
- `cpptrace::from_current_exception`: Returns a resolved `const stacktrace&` from the current exception. Invalidates
references to traces returned by `cpptrace::raw_trace_from_current_exception`.
In order to provide stack traces, cpptrace has to do some magic to be able to intercept C++ exception handling internals
before the stack is unwound. For a simple `try`/`catch`, `CPPTRACE_TRY`/`CPPTRACE_CATCH` macros can be used. For a
`try`/`catch` that has multiple handlers, `cpptrace::try_catch` can be used. I wish I could make a macro work, however,
for multiple handlers this is the best way for cpptrace to inject the appropriate magic. E.g.:
```cpp
cpptrace::try_catch(
[&] { // try block
foo();
},
[&] (const std::runtime_error& e) {
std::cerr<<"Runtime error: "<<e.what()<<std::endl;
cpptrace::from_current_exception().print();
},
[&] (const std::exception& e) {
std::cerr<<"Exception: "<<e.what()<<std::endl;
cpptrace::from_current_exception().print();
},
[&] () { // serves the same role as `catch(...)`, an any exception handler
std::cerr<<"Unknown exception occurred: "<<std::endl;
cpptrace::from_current_exception().print();
}
);
```
Note: The current exception is the exception most recently seen by a cpptrace try-catch macro block.
```cpp
CPPTRACE_TRY {
throw std::runtime_error("foo");
} CPPTRACE_CATCH(const std::exception& e) {
cpptrace::from_current_exception().print(); // the trace for std::runtime_error("foo")
CPPTRACE_TRY {
throw std::runtime_error("bar");
} CPPTRACE_CATCH(const std::exception& e) {
cpptrace::from_current_exception().print(); // the trace for std::runtime_error("bar")
}
cpptrace::from_current_exception().print(); // the trace for std::runtime_error("bar"), again
}
```
Note: Internally the trace contains some extra frames for calls like `__cxa_throw`, `_UnwindRaiseException`, etc. These
are filtered out during stacktrace printing but they will be present if you manually inspect the vector of stacktrace
frames.
> [!IMPORTANT]
> There is an unfortunate limitation with `return` statements in these try/catch macros: The implementation on Windows
> requires wrapping the try body in an immediately-invoked lambda and as such `return` statements would return from the
> lambda not the enclosing function. Cpptrace guards against misleading `return`s compiling by requiring the lambdas to
> return a special internal type, but, if you're writing code that will be compiled on windows it's important to not
> write `return` statements within CPPTRACE_TRY. For example, this is invalid:
> ```cpp
> CPPTRACE_TRY {
> if(condition) return 40; // error, type int doesn't match cpptrace::detail::dont_return_from_try_catch_macros
> } CPPTRACE_CATCH(const std::exception& e) {
> ...
> }
> ```
> [!IMPORTANT]
> There is a footgun which is mainly relevant for code that was written on an older version of cpptrace: It's possible
> to write the following without getting errors
> ```cpp
> CPPTRACE_TRY {
> ...
> } CPPTRACE_CATCH(const std::runtime_error& e) {
> ...
> } catch(const std::exception& e) {
> ...
> }
> ```
> This code will compile and the second catch handler will work, however, cpptrace won't know about the handler and as
> such it won't be able to correctly collect a trace when a type that does not match `std::runtime_error` is thrown. No
> run-time errors will occur, however, `from_current_exception` will report a misleading trace.
### Removing the `CPPTRACE_` prefix
`CPPTRACE_TRY` is a little cumbersome to type. To remove the `CPPTRACE_` prefix you can use the
`CPPTRACE_UNPREFIXED_TRY_CATCH` cmake option or the `CPPTRACE_UNPREFIXED_TRY_CATCH` preprocessor definition:
```cpp
TRY {
foo();
} CATCH(const std::exception& e) {
std::cerr<<"Exception: "<<e.what()<<std::endl;
cpptrace::from_current_exception().print();
}
```
This is not done by default for macro safety/hygiene reasons. If you do not want `TRY`/`CATCH` macros defined, as they
are common macro names, you can easily modify the following snippet to provide your own aliases:
```cpp
#define TRY CPPTRACE_TRY
#define CATCH(param) CPPTRACE_CATCH(param)
```
### How it works
C++ does not provide any language support for collecting stack traces when exceptions are thrown, however, exception
handling under both the Itanium ABI and by SEH (used to implement C++ exceptions on Windows) involves unwinding the
stack twice. The first unwind searches for an appropriate `catch` handler, the second actually unwinds the stack and
calls destructors. Since the stack remains intact during the search phase it's possible to collect a stack trace with
little to no overhead when the `catch` is considered for matching the exception. The try/catch macros for cpptrace set
up a special try/catch system that can collect a stack trace when considered during a search phase.
On Windows, cpptrace's try/catch macros expand along the lines of:
<table>
<thead>
<tr>
<td>
Source
</td>
<td>
Expansion
</td>
</tr>
</thead>
<tbody>
<tr>
<td>
```cpp
CPPTRACE_TRY {
foo();
} CPPTRACE_CATCH(const std::exception& e) {
...
}
```
</td>
<td>
```cpp
try {
[&]() {
__try {
[&]() {
foo();
}();
} __except(exception_filter<const std::exception&>(
GetExceptionInformation()
)) {}
}();
} catch(const std::exception& e) {
...
}
```
</td>
</tr>
</tbody>
</table>
SEH's design actually makes it fairly easy to run code during the search phase. The exception filter will collect a
trace if it detects the catch will match. Unfortunately, MSVC does not allow mixing C++ `try`/`catch` and SEH
`__try`/`__except` in the same function so a double-IILE is needed. This has implications for returning from try blocks.
On systems which use the Itanium ABI (linux, mac, etc), cpptrace's try/catch macros expand along the lines of:
<table>
<thead>
<tr>
<td>
Source
</td>
<td>
Expansion
</td>
</tr>
</thead>
<tbody>
<tr>
<td>
```cpp
CPPTRACE_TRY {
foo();
} CPPTRACE_CATCH(const std::exception& e) {
...
}
```
</td>
<td>
```cpp
try {
try {
foo();
} catch(const unwind_interceptor_for<const std::exception&>&) {...}
} catch(const std::exception& e) {
...
}
```
</td>
</tr>
</tbody>
</table>
Cpptrace does some magic to hook vtables of `unwind_interceptor_for<T>` type_info objects during static-init time.
N.b.: This mechanism is also discussed in [P2490R3][P2490R3].
### Performance
The performance impact in the non-throwing happy path is zero (or as close to zero as practical) on modern
architectures.
In the unhappy throwing path, a little more work may be done during the search phase to consider handlers cpptrace
inserts but this is low-impact. Generating the trace itself is fast: Cpptrace collects a raw trace during exception
handling and it is resolved only when requested. In my benchmarking I have found generation of raw traces to take on the
order of `100ns` per frame.
On some older architectures/ABIs (e.g., 32-bit windows), `try`/`catch` itself has some overhead due to how it is
implemented with SEH. Cpptrace's `try`/`catch` macro adds one extra layer of handler which may be relevant on such
systems but should not be a problem outside of hot loops, where using any `try`/`catch` is presumably already a problem
on such architectures.
## Rethrowing Exceptions
By default `cpptrace::from_current_exception` will correspond to a trace for the last `throw` intercepted by a
`CPPTRACE_CATCH`. In order to rethrow an exception while preserving the original trace, `cpptrace::rethrow()` can be
used.
```cpp
namespace cpptrace {
void rethrow();
void rethrow(std::exception_ptr exception = std::current_exception());
}
```
> [!NOTE]
> It's important to use `cpptrace::rethrow()` from within a `CPPTRACE_CATCH`. If it is not, then no trace for the
> exception origin will have been collected.
Example:
```cpp
void bar() {
throw std::runtime_error("critical error in bar");
}
void foo() {
CPPTRACE_TRY {
bar();
} CPPTRACE_CATCH(const std::exception& e) {
std::cerr<<"Exception in foo: "<<e.what()<<std::endl;
cpptrace::rethrow();
}
}
int main() {
CPPTRACE_TRY {
foo();
} CPPTRACE_CATCH(const std::exception& e) {
std::cerr<<"Exception encountered while running foo: "<<e.what()<<std::endl;
cpptrace::from_current_exception().print(); // prints trace containing main -> foo -> bar
}
}
```
Sometimes it may be desirable to see both the trace for the exception's origin as well as the trace for where it was
rethrown. Cpptrace provides an interface for getting the last rethrow location:
```cpp
namespace cpptrace {
const raw_trace& raw_trace_from_current_exception_rethrow();
const stacktrace& from_current_exception_rethrow();
bool current_exception_was_rethrown();
}
```
If the current exception was not rethrown, these functions return references to empty traces.
`current_exception_was_rethrown` can be used to check if the current exception was rethrown and a non-empty rethrow
trace exists.
Example usage, utilizing `foo` and `bar` from the above example:
```cpp
int main() {
CPPTRACE_TRY {
foo();
} CPPTRACE_CATCH(const std::exception& e) {
std::cerr<<"Exception encountered while running foo: "<<e.what()<<std::endl;
std::cerr<<"Thrown from:"<<std::endl;
cpptrace::from_current_exception().print(); // trace containing main -> foo -> bar
std::cerr<<"Rethrown from:"<<std::endl;
cpptrace::from_current_exception_rethrow().print(); // trace containing main -> foo
}
}
```
## `cpptrace::try_catch`
As mentioned above, in order to facilitate `try`/`catch` blocks with multiple handlers while still being able to perform
the magic necessary to collect stack traces on exceptions, cpptrace provides a `cpptrace::try_catch` utility that can
take multiple handlers:
```cpp
cpptrace::try_catch(
[&] { // try block
foo();
},
[&] (const std::runtime_error& e) {
std::cerr<<"Runtime error: "<<e.what()<<std::endl;
cpptrace::from_current_exception().print();
},
[&] (const std::exception& e) {
std::cerr<<"Exception: "<<e.what()<<std::endl;
cpptrace::from_current_exception().print();
},
[&] () { // serves the same role as `catch(...)`, an any exception handler
std::cerr<<"Unknown exception occurred: "<<std::endl;
cpptrace::from_current_exception().print();
}
);
```
The synopsis for this utility is:
```cpp
namespace cpptrace {
template<typename F, typename... Catches>
void try_catch(F&& f, Catches&&... catches);
}
```
Similar to a language `try`/`catch`, `catch` handlers will be considered in the order they are listed. Handlers should
take exactly one argument, equivalent to what would be written for a catch handler, except for `catch(...)` which can be
achieved by a handler taking no arguments.
## Traces from SEH exceptions
Similar to the above section on collecting [traces from C++ exceptions](#traces-from-all-exceptions-cpptrace_try-and-cpptrace_catch),
cpptrace provides `CPPTRACE_SEH_TRY` and `CPPTRACE_SEH_EXCEPT` macros that collect traces from SEH exceptions on windows
with no overhead in the non-throwing (happy) path:
```cpp
#include <cpptrace/from_current.hpp>
#include <iostream>
#include <windows.h>
void foo(int x, int y) {
return x / y;
}
int divide_zero_filter(int code) {
if(code == STATUS_INTEGER_DIVIDE_BY_ZERO || code == EXCEPTION_FLT_DIVIDE_BY_ZERO) {
return EXCEPTION_EXECUTE_HANDLER;
}
return EXCEPTION_CONTINUE_SEARCH;
}
int main() {
CPPTRACE_SEH_TRY {
foo(10, 0);
} CPPTRACE_SEH_EXCEPT(divide_zero_filter(GetExceptionCode())) {
std::cerr<<"Division by zero happened!"<<std::endl;
cpptrace::from_current_exception().print();
}
}
```
The `CPPTRACE_SEH_EXCEPT` macro takes a filter expression as input, any expression valid in `__except` is valid.
## Traced Exception Objects
Cpptrace provides a handful of traced exception classes which automatically collect stack traces when thrown. These
are useful when throwing exceptions that may not be caught by `CPPTRACE_CATCH`.
The base traced exception class is `cpptrace::exception` and cpptrace provides a handful of helper classes for working
with traced exceptions. These exceptions generate relatively lightweight raw traces and resolve symbols and line numbers
lazily if and when requested.
These are provided both as a useful utility and as a reference implementation for traced exceptions.
The basic interface is:
```cpp
namespace cpptrace {
class exception : public std::exception {
public:
virtual const char* what() const noexcept = 0; // The what string both the message and trace
virtual const char* message() const noexcept = 0;
virtual const stacktrace& trace() const noexcept = 0;
};
}
```
There are two ways to go about traced exception objects: Traces can be resolved eagerly or lazily. Cpptrace provides the
basic implementation of exceptions as lazy exceptions. I hate to have anything about the implementation exposed in the
interface or type system but this seems to be the best way to do this.
```cpp
namespace cpptrace {
class lazy_exception : public exception {
// lazy_trace_holder is basically a std::variant<raw_trace, stacktrace>, more docs later
mutable detail::lazy_trace_holder trace_holder;
mutable std::string what_string;
public:
explicit lazy_exception(
raw_trace&& trace = detail::get_raw_trace_and_absorb()
) noexcept : trace_holder(std::move(trace)) {}
const char* what() const noexcept override;
const char* message() const noexcept override;
const stacktrace& trace() const noexcept override;
};
}
```
`cpptrace::lazy_exception` can be freely thrown or overridden. Generally `message()` is the only field to override.
Lastly cpptrace provides an exception class that takes a user-provided message, `cpptrace::exception_with_message`, as
well as a number of traced exception classes resembling `<stdexcept>`:
```cpp
namespace cpptrace {
class exception_with_message : public lazy_exception {
mutable std::string user_message;
public:
explicit exception_with_message(
std::string&& message_arg,
raw_trace&& trace = detail::get_raw_trace_and_absorb()
) noexcept : lazy_exception(std::move(trace)), user_message(std::move(message_arg)) {}
const char* message() const noexcept override;
};
// All stdexcept errors have analogs here. All but system_error have the constructor:
// explicit the_error(
// std::string&& message_arg,
// raw_trace&& trace = detail::get_raw_trace_and_absorb()
// ) noexcept
// : exception_with_message(std::move(message_arg), std::move(trace)) {}
class logic_error : public exception_with_message { ... };
class domain_error : public exception_with_message { ... };
class invalid_argument : public exception_with_message { ... };
class length_error : public exception_with_message { ... };
class out_of_range : public exception_with_message { ... };
class runtime_error : public exception_with_message { ... };
class range_error : public exception_with_message { ... };
class overflow_error : public exception_with_message { ... };
class underflow_error : public exception_with_message { ... };
class system_error : public runtime_error {
public:
explicit system_error(
int error_code,
std::string&& message_arg,
raw_trace&& trace = detail::get_raw_trace_and_absorb()
) noexcept;
const std::error_code& code() const noexcept;
};
}
```
### Wrapping std::exceptions
> [!NOTE]
> This section is largely obsolete now that cpptrace provides a better mechanism for collecting
> [traces from exceptions](#traces-from-exceptions)
Cpptrace exceptions can provide great information for user-controlled exceptions. For non-cpptrace::exceptions that may
originate outside of code you control, e.g. the standard library, cpptrace provides some wrapper utilities that can
rethrow these exceptions nested in traced cpptrace exceptions. The trace won't be perfect, the trace will start where
the wrapper caught it, but these utilities can provide good diagnostic information. Unfortunately this is the best
solution for this problem, as far as I know.
```cpp
std::vector<int> foo = {1, 2, 3};
CPPTRACE_WRAP_BLOCK(
foo.at(4) = 2;
foo.at(5)++;
);
std::cout<<CPPTRACE_WRAP(foo.at(12))<<std::endl;
```
### Exception handling with cpptrace exception objects
> [!NOTE]
> This section pertains to cpptrace traced exception objects and not the mechanism for collecting
> [traces from arbitrary exceptions](#traces-from-exceptions)
Working with cpptrace exceptions in your code:
```cpp
try {
foo();
} catch(cpptrace::exception& e) {
// Prints the exception info and stack trace, conditionally enabling color codes depending on
// whether stderr is a terminal
std::cerr << "Error: " << e.message() << '\n';
e.trace().print(std::cerr, cpptrace::isatty(cpptrace::stderr_fileno));
} catch(std::exception& e) {
std::cerr << "Error: " << e.what() << '\n';
}
```
## Terminate Handling
Cpptrace provides a custom `std::terminate` handler that prints stacktraces while otherwise behaving like the normal
`std::terminate` handler. If a cpptrace exception object reaches `std::terminate` the trace from that exception is
printed, otherwise a stack trace is generated at the point of the terminate handler. Often `std::terminate` is called
directly without unwinding so the trace is preserved.
To register this custom handler:
```cpp
cpptrace::register_terminate_handler();
```
## Signal-Safe Tracing
Stack traces from signal handlers can provide very helpful information for debugging application crashes, e.g. from
SIGSEGV or SIGTRAP handlers. Signal handlers are really restrictive environments as your application could be
interrupted by a signal at any point, including in the middle of malloc or buffered IO or while holding a lock.
Doing a stack trace in a signal handler is possible but it requires a lot of care. This is difficult to do correctly
and most examples online do this incorrectly.
Cpptrace offers an API to walk the stack in a signal handler and produce a raw trace safely. The library also provides
an interface for producing a object frame safely:
```cpp
namespace cpptrace {
std::size_t safe_generate_raw_trace(frame_ptr* buffer, std::size_t size, std::size_t skip = 0);
std::size_t safe_generate_raw_trace(frame_ptr* buffer, std::size_t size, std::size_t skip, std::size_t max_depth);
struct safe_object_frame {
frame_ptr raw_address;
frame_ptr address_relative_to_object_start;
char object_path[CPPTRACE_PATH_MAX + 1];
object_frame resolve() const; // To be called outside a signal handler. Not signal safe.
};
void get_safe_object_frame(frame_ptr address, safe_object_frame* out);
bool can_signal_safe_unwind();
bool can_get_safe_object_frame();
}
```
It is not possible to resolve debug symbols safely in the process from a signal handler without heroic effort. In order
to produce a full trace there are three options:
1. Carefully save the object trace information to be resolved at a later time outside the signal handler
2. Write the object trace information to a file to be resolved later
3. Spawn a new process, communicate object trace information to that process, and have that process do the trace
resolution
For traces on segfaults, e.g., only options 2 and 3 are viable. For more information an implementation of approach 3,
see the comprehensive overview and demo at [signal-safe-tracing.md](docs/signal-safe-tracing.md).
> [!IMPORTANT]
> Currently signal-safe stack unwinding is only possible with `libunwind`, which must be
> [manually enabled](#library-back-ends). If signal-safe unwinding isn't supported, `safe_generate_raw_trace` will just
> produce an empty trace. `can_signal_safe_unwind` can be used to check for signal-safe unwinding support and
> `can_get_safe_object_frame` can be used to check `get_safe_object_frame` support. If object information can't be
> resolved in a signal-safe way then `get_safe_object_frame` will not populate fields beyond the `raw_address`.
> [!IMPORTANT]
> `_dl_find_object` is required for signal-safe stack tracing. This is a relatively recent addition to glibc, added in
> glibc 2.35.
> [!CAUTION]
> Calls to shared objects can be lazy-loaded where the first call to the shared object invokes non-signal-safe functions
> such as `malloc()`. To avoid this, call these routines in `main()` ahead of a signal handler to "warm up" the library.
## Utility Types
A couple utility types are used to provide the library with a good interface.
`nullable<T>` is used for a nullable integer type. Internally the maximum value for `T` is used as a
sentinel. `std::optional` would be used if this library weren't c++11. But, `nullable<T>` provides
an `std::optional`-like interface and it's less heavy-duty for this use than an `std::optional`.
`detail::lazy_trace_holder` is a utility type for `lazy_exception` used in place of an
`std::variant<raw_trace, stacktrace>`.
```cpp
namespace cpptrace {
template<typename T, typename std::enable_if<std::is_integral<T>::value, int>::type = 0>
struct nullable {
T raw_value;
// all members are constexpr for c++17 and beyond, some are constexpr before c++17
nullable& operator=(T value)
bool has_value() const noexcept;
T& value() noexcept;
const T& value() const noexcept;
T value_or(T alternative) const noexcept;
void swap(nullable& other) noexcept;
void reset() noexcept;
bool operator==(const nullable& other) const noexcept;
bool operator!=(const nullable& other) const noexcept;
constexpr static T null_value() noexcept; // returns the raw null value
constexpr static nullable null() noexcept; // returns a null instance
};
namespace detail {
class lazy_trace_holder {
bool resolved;
union {
raw_trace trace;
stacktrace resolved_trace;
};
public:
// constructors
lazy_trace_holder() : trace() {}
explicit lazy_trace_holder(raw_trace&& _trace);
explicit lazy_trace_holder(stacktrace&& _resolved_trace);
// logistics
lazy_trace_holder(const lazy_trace_holder& other);
lazy_trace_holder(lazy_trace_holder&& other) noexcept;
lazy_trace_holder& operator=(const lazy_trace_holder& other);
lazy_trace_holder& operator=(lazy_trace_holder&& other) noexcept;
~lazy_trace_holder();
// access
const raw_trace& get_raw_trace() const;
stacktrace& get_resolved_trace();
const stacktrace& get_resolved_trace() const; // throws if not already resolved
bool is_resolved() const;
private:
void clear();
};
}
}
```
## Headers
Cpptrace provides a handful of headers to make inclusion more minimal.
| Header | Contents |
| --------------------------- | ----------------------------------------------------------------------------------------------------------------------------------------------------------------------------------------------------- |
| `cpptrace/forward.hpp` | `cpptrace::frame_ptr` and a few trace class forward declarations |
| `cpptrace/basic.hpp` | Definitions for trace classes and the basic tracing APIs ([Stack Traces](#stack-traces), [Object Traces](#object-traces), [Raw Traces](#raw-traces), and [Signal-Safe Tracing](#signal-safe-tracing)) |
| `cpptrace/exceptions.hpp` | [Traced Exception Objects](#traced-exception-objects) and related utilities ([Wrapping std::exceptions](#wrapping-stdexceptions)) |
| `cpptrace/from_current.hpp` | [Traces From All Exceptions](#traces-from-all-exceptions) |
| `cpptrace/io.hpp` | `operator<<` overloads for `std::ostream` and `std::formatter`s |
| `cpptrace/formatting.hpp` | Configurable formatter API |
| `cpptrace/utils.hpp` | Utility functions, configuration functions, and terminate utilities ([Utilities](#utilities), [Configuration](#configuration), and [Terminate Handling](#terminate-handling)) |
| `cpptrace/version.hpp` | Library version macros |
| `cpptrace/gdb_jit.hpp` | Provides a special utility related to [JIT support](#jit-support) |
The main cpptrace header is `cpptrace/cpptrace.hpp` which includes everything other than `from_current.hpp` and
`version.hpp`.
## Libdwarf Tuning
For extraordinarily large binaries (multiple gigabytes), cpptrace's internal caching can result in a lot of memory
usage. Cpptrace provides some options to reduce memory usage in exchange for performance in memory-constrained
applications.
Synopsis:
```cpp
namespace cpptrace {
namespace experimental {
void set_dwarf_resolver_line_table_cache_size(nullable<std::size_t> max_entries);
void set_dwarf_resolver_disable_aranges(bool disable);
}
}
```
Explanation:
- `set_dwarf_resolver_line_table_cache_size` can be used to set a limit to the cache size with evictions done LRU.
Cpptrace loads and caches line tables for dwarf compile units. These can take a lot of space for large binaries with
lots of debug info. Passing `nullable<std::size_t>::null()` will disable the cache size (which is the default
behavior).
- `set_dwarf_resolver_disable_aranges` can be used to disable use of dwarf `.debug_aranges`, an accelerated range lookup
table for compile units emitted by many compilers. Cpptrace uses these by default if they are present since they can
speed up resolution, however, they can also result in significant memory usage.
## JIT Support
Cpptrace has support for resolving symbols from frames in JIT-compiled code. To do this, cpptrace relies on in-memory
object files (elf on linux or mach-o on mac) that contain symbol tables and dwarf debug information. The main reason for
this is many JIT implementations already produce these for debugger support.
These in-memory object files must be set up in such a way that the symbol table and debug symbol addresses match the
run-time addresses of the JIT code.
The basic interface for informing cpptrace about these in-memory object files is as follows:
```cpp
namespace cpptrace {
void register_jit_object(const char*, std::size_t);
void unregister_jit_object(const char*);
void clear_all_jit_objects();
}
```
Many JIT implementations follow the GDB [JIT Compilation Interface][jitci] so that JIT code can be debugged. The
interface, at a high level, entails adding in-memory object files to a linked list of object files that GDB and other
debuggers can reference (stored in the `__jit_debug_descriptor`). Cpptrace provides, as a utility, a mechanism for
loading all in-memory object files present in the `__jit_debug_descriptor` linked list via `<cpptrace/gdb_jit.hpp>`:
```cpp
namespace cpptrace {
namespace experimental {
void register_jit_objects_from_gdb_jit_interface();
}
}
```
Note: Your program must be able to link against a global C symbol `__jit_debug_descriptor`.
Note: Calling `cpptrace::experimental::register_jit_objects_from_gdb_jit_interface` clears all jit objects previously
registered with cpptrace.
[jitci]: https://sourceware.org/gdb/current/onlinedocs/gdb.html/JIT-Interface.html
## Loading Libraries at Runtime
This section only applies to the dbghelp backend (`CPPTRACE_GET_SYMBOLS_WITH_DBGHELP`) on Windows.
When loading a DLL at runtime with `LoadLibrary` after a stacktrace has already been generated,
symbols from that library may not be resolved correctly for subsequent stacktraces. To fix this,
call `cpptrace::load_symbols_for_file` with the same path that was passed to `LoadLibrary`.
```cpp
HMODULE hModule = LoadLibrary("mydll.dll");
if (hModule) {
cpptrace::load_symbols_for_file("mydll.dll");
}
```
For backends other than dbghelp, `load_symbols_for_file` does nothing. For platforms other than
Windows, it is not declared.
```cpp
namespace cpptrace {
void load_symbols_for_file(const std::string& filename);
}
```
# ABI Versioning
Since cpptrace v1.0.0, the library uses an inline ABI versioning namespace and all symbols part of the public interface
are secretly under the namespace `cpptrace::v1`. This is done to allow for potential future library evolution in an
ABI-friendly manner.
# Supported Debug Formats
| Format | Supported |
| ---------------------------- | --------- |
| DWARF in binary | ✔️ |
| GNU debug link | ️️✔️ |
| Split dwarf (debug fission) | ✔️ |
| DWARF in dSYM | ✔️ |
| DWARF via Mach-O debug map | ✔️ |
| Windows debug symbols in PDB | ✔️ |
DWARF5 added DWARF package files. As far as I can tell no compiler implements these yet.
# How to Include The Library
## CMake FetchContent
With CMake FetchContent:
```cmake
include(FetchContent)
FetchContent_Declare(
cpptrace
GIT_REPOSITORY https://github.com/jeremy-rifkin/cpptrace.git
GIT_TAG v1.0.4 # <HASH or TAG>
)
FetchContent_MakeAvailable(cpptrace)
target_link_libraries(your_target cpptrace::cpptrace)
```
It's as easy as that. Cpptrace will automatically configure itself for your system. Note: On windows and macos some
extra work is required, see [Platform Logistics](#platform-logistics) below.
Be sure to configure with `-DCMAKE_BUILD_TYPE=Debug` or `-DCMAKE_BUILD_TYPE=RelWithDebInfo` for symbols and line
information.
## System-Wide Installation
```sh
git clone https://github.com/jeremy-rifkin/cpptrace.git
git checkout v1.0.4
mkdir cpptrace/build
cd cpptrace/build
cmake .. -DCMAKE_BUILD_TYPE=Release
make -j
sudo make install
```
Using through cmake:
```cmake
find_package(cpptrace REQUIRED)
target_link_libraries(<your target> cpptrace::cpptrace)
```
Be sure to configure with `-DCMAKE_BUILD_TYPE=Debug` or `-DCMAKE_BUILD_TYPE=RelWithDebInfo` for symbols and line
information.
Or compile with `-lcpptrace`:
```sh
g++ main.cpp -o main -g -Wall -lcpptrace
./main
```
> [!IMPORTANT]
> If you aren't using cmake and are linking statically you must manually specify `-DCPPTRACE_STATIC_DEFINE`.
If you get an error along the lines of
```
error while loading shared libraries: libcpptrace.so: cannot open shared object file: No such file or directory
```
You may have to run `sudo /sbin/ldconfig` to create any necessary links and update caches so the system can find
libcpptrace.so (I had to do this on Ubuntu). Only when installing system-wide. Usually your package manager does this for
you when installing new libraries.
> [!NOTE]
> Libdwarf requires a relatively new version of libdwarf. Sometimes a previously-installed system-wide libdwarf may
> cause issues due to being too old. Libdwarf 8 and newer is known to work.
<details>
<summary>System-wide install on windows</summary>
```ps1
git clone https://github.com/jeremy-rifkin/cpptrace.git
git checkout v1.0.4
mkdir cpptrace/build
cd cpptrace/build
cmake .. -DCMAKE_BUILD_TYPE=Release
msbuild cpptrace.sln
msbuild INSTALL.vcxproj
```
Note: You'll need to run as an administrator in a developer powershell, or use vcvarsall.bat distributed with visual
studio to get the correct environment variables set.
</details>
## Local User Installation
To install just for the local user (or any custom prefix):
```sh
git clone https://github.com/jeremy-rifkin/cpptrace.git
git checkout v1.0.4
mkdir cpptrace/build
cd cpptrace/build
cmake .. -DCMAKE_BUILD_TYPE=Release -DCMAKE_INSTALL_PREFIX=$HOME/wherever
make -j
make install
```
Using through cmake:
```cmake
find_package(cpptrace REQUIRED PATHS $ENV{HOME}/wherever)
target_link_libraries(<your target> cpptrace::cpptrace)
```
Using manually:
```
g++ main.cpp -o main -g -Wall -I$HOME/wherever/include -L$HOME/wherever/lib -lcpptrace
```
> [!IMPORTANT]
> If you aren't using cmake and are linking statically you must manually specify `-DCPPTRACE_STATIC_DEFINE`.
## Use Without CMake
To use the library without cmake first follow the installation instructions at
[System-Wide Installation](#system-wide-installation), [Local User Installation](#local-user-installation),
or [Package Managers](#package-managers).
In addition to any include or library paths you'll need to specify to tell the compiler where cpptrace was installed.
The typical dependencies for cpptrace are:
| Compiler | Platform | Dependencies |
| ----------------------- | ---------------- | ----------------------------------------- |
| gcc, clang, intel, etc. | Linux/macos/unix | `-lcpptrace -ldwarf -lz -lzstd -ldl` |
| gcc | Windows | `-lcpptrace -ldbghelp -ldwarf -lz -lzstd` |
| msvc | Windows | `cpptrace.lib dbghelp.lib` |
| clang | Windows | `-lcpptrace -ldbghelp` |
Note: Newer libdwarf requires `-lzstd`, older libdwarf does not.
> [!IMPORTANT]
> If you are linking statically, you will additionally need to specify `-DCPPTRACE_STATIC_DEFINE`.
Dependencies may differ if different back-ends are manually selected.
## Installation Without Package Managers or FetchContent
Some users may prefer, or need to, to install cpptrace without package managers or fetchcontent (e.g. if their system
does not have internet access). Below are instructions for how to install libdwarf and cpptrace.
<details>
<summary>Installation Without Package Managers or FetchContent</summary>
Here is an example for how to build cpptrace and libdwarf. `~/scratch/cpptrace-test` is used as a working directory and
the libraries are installed to `~/scratch/cpptrace-test/resources`.
```sh
mkdir -p ~/scratch/cpptrace-test/resources
cd ~/scratch/cpptrace-test
git clone https://github.com/facebook/zstd.git
cd zstd
git checkout 63779c798237346c2b245c546c40b72a5a5913fe
cd build/cmake
mkdir build
cd build
cmake .. -DCMAKE_INSTALL_PREFIX=~/scratch/cpptrace-test/resources -DZSTD_BUILD_PROGRAMS=On -DZSTD_BUILD_CONTRIB=On -DZSTD_BUILD_TESTS=On -DZSTD_BUILD_STATIC=On -DZSTD_BUILD_SHARED=On -DZSTD_LEGACY_SUPPORT=On
make -j
make install
cd ~/scratch/cpptrace-test
git clone https://github.com/jeremy-rifkin/libdwarf-lite.git
cd libdwarf-lite
git checkout 5dfb2cd2aacf2bf473e5bfea79e41289f88b3a5f # 2.1.0
mkdir build
cd build
cmake .. -DPIC_ALWAYS=On -DBUILD_DWARFDUMP=Off -DCMAKE_PREFIX_PATH=~/scratch/cpptrace-test/resources -DCMAKE_INSTALL_PREFIX=~/scratch/cpptrace-test/resources
make -j
make install
cd ~/scratch/cpptrace-test
git clone https://github.com/jeremy-rifkin/cpptrace.git
cd cpptrace
git checkout v1.0.4
mkdir build
cd build
cmake .. -DCMAKE_BUILD_TYPE=Release -DBUILD_SHARED_LIBS=On -DCPPTRACE_USE_EXTERNAL_LIBDWARF=On -DCMAKE_PREFIX_PATH=~/scratch/cpptrace-test/resources -DCMAKE_INSTALL_PREFIX=~/scratch/cpptrace-test/resources
make -j
make install
```
The `~/scratch/cpptrace-test/resources` directory also serves as a bundle you can ship with all the installed files for
cpptrace and its dependencies.
</details>
## Package Managers
### Conan
Cpptrace is available through conan at https://conan.io/center/recipes/cpptrace.
```
[requires]
cpptrace/1.0.4
[generators]
CMakeDeps
CMakeToolchain
[layout]
cmake_layout
```
```cmake
# ...
find_package(cpptrace REQUIRED)
# ...
target_link_libraries(YOUR_TARGET cpptrace::cpptrace)
```
### Vcpkg
```
vcpkg install cpptrace
```
```cmake
find_package(cpptrace CONFIG REQUIRED)
target_link_libraries(main PRIVATE cpptrace::cpptrace)
```
## C++20 Modules
Cpptrace supports C++20 modules: `import cpptrace;`. You'll need a modern toolchain in order to use C++20 modules (i.e.
relatively new compilers, cmake, etc).
For features involving macros you will have to `#include` headers with the macro definitions:
- `<cpptrace/exceptions_macros.hpp>`: `CPPTRACE_WRAP` and `CPPTRACE_WRAP_BLOCK`
- `<cpptrace/from_current_macros.hpp>`: `CPPTRACE_TRY`, `CPPTRACE_CATCH`, etc.
# Platform Logistics
Windows and macOS require a little extra work to get everything in the right place.
## Windows
Copying the library `.dll` on Windows:
```cmake
# Copy the cpptrace.dll on windows to the same directory as the executable for your_target.
# Not required if static linking.
if(WIN32)
add_custom_command(
TARGET your_target POST_BUILD
COMMAND ${CMAKE_COMMAND} -E copy_if_different
$<TARGET_FILE:cpptrace::cpptrace>
$<TARGET_FILE_DIR:your_target>
)
endif()
```
## macOS
On macOS, it is recommended to generate a `dSYM` file containing debug information for your program.
This is not required as cpptrace makes a good effort at finding and reading the debug information
without this, but having a `dSYM` file is the most robust method.
When using Xcode with CMake, this can be done with:
```cmake
set_target_properties(your_target PROPERTIES XCODE_ATTRIBUTE_DEBUG_INFORMATION_FORMAT "dwarf-with-dsym")
```
Outside of Xcode, this can be done with `dsymutil yourbinary`:
```cmake
# Create a .dSYM file on macOS
if(APPLE)
add_custom_command(
TARGET your_target
POST_BUILD
COMMAND dsymutil $<TARGET_FILE:your_target>
)
endif()
```
# Library Back-Ends
Cpptrace supports a number of back-ends to produce stack traces. Stack traces are produced in roughly three steps:
Unwinding, symbol resolution, and demangling.
The library's CMake automatically configures itself for what your system supports. The ideal configuration is as
follows:
| Platform | Unwinding | Symbols | Demangling |
| -------- | ------------------------------------------------------- | ------------------ | -------------------- |
| Linux | `_Unwind` | libdwarf | cxxabi.h |
| MacOS | `_Unwind` for gcc, execinfo.h for clang and apple clang | libdwarf | cxxabi.h |
| Windows | `StackWalk64` | dbghelp | No demangling needed |
| MinGW | `StackWalk64` | libdwarf + dbghelp | cxxabi.h |
Support for these back-ends is the main development focus and they should work well. If you want to use a different
back-end such as addr2line, for example, you can configure the library to do so.
**Unwinding**
| Library | CMake config | Platforms | Info |
| ------------- | -------------------------------- | ---------------------------- | -------------------------------------------------------------------------------------------------------------------------------------------------------------------------------------------------------------------- |
| libgcc unwind | `CPPTRACE_UNWIND_WITH_UNWIND` | linux, macos, mingw | Frames are captured with libgcc's `_Unwind_Backtrace`, which currently produces the most accurate stack traces on gcc/clang/mingw. Libgcc is often linked by default, and llvm has something equivalent. |
| execinfo.h | `CPPTRACE_UNWIND_WITH_EXECINFO` | linux, macos | Frames are captured with `execinfo.h`'s `backtrace`, part of libc on linux/unix systems. |
| winapi | `CPPTRACE_UNWIND_WITH_WINAPI` | windows, mingw | Frames are captured with `CaptureStackBackTrace`. |
| dbghelp | `CPPTRACE_UNWIND_WITH_DBGHELP` | windows, mingw | Frames are captured with `StackWalk64`. |
| libunwind | `CPPTRACE_UNWIND_WITH_LIBUNWIND` | linux, macos, windows, mingw | Frames are captured with [libunwind](https://github.com/libunwind/libunwind). **Note:** This is the only back-end that requires a library to be installed by the user, and a `CMAKE_PREFIX_PATH` may also be needed. |
| N/A | `CPPTRACE_UNWIND_WITH_NOTHING` | all | Unwinding is not done, stack traces will be empty. |
Some back-ends (execinfo and `CaptureStackBackTrace`) require a fixed buffer has to be created to read addresses into
while unwinding. By default the buffer can hold addresses for 400 frames (beyond the `skip` frames). This is
configurable with `CPPTRACE_HARD_MAX_FRAMES`.
**Symbol resolution**
| Library | CMake config | Platforms | Info |
| ------------ | ---------------------------------------- | --------------------- | -------------------------------------------------------------------------------------------------------------------------------------------------------------------------------------------- |
| libdwarf | `CPPTRACE_GET_SYMBOLS_WITH_LIBDWARF` | linux, macos, mingw | Libdwarf is the preferred method for symbol resolution for cpptrace. Cpptrace will get it via FetchContent or find_package depending on `CPPTRACE_USE_EXTERNAL_LIBDWARF`. |
| dbghelp | `CPPTRACE_GET_SYMBOLS_WITH_DBGHELP` | windows | Dbghelp.h is the preferred method for symbol resolution on windows under msvc/clang and is supported on all windows machines. |
| libbacktrace | `CPPTRACE_GET_SYMBOLS_WITH_LIBBACKTRACE` | linux, macos*, mingw* | Libbacktrace is already installed on most systems or available through the compiler directly. For clang you must specify the absolute path to `backtrace.h` using `CPPTRACE_BACKTRACE_PATH`. |
| addr2line | `CPPTRACE_GET_SYMBOLS_WITH_ADDR2LINE` | linux, macos, mingw | Symbols are resolved by invoking `addr2line` (or `atos` on mac) via `fork()` (on linux/unix, and `popen` under mingw). |
| libdl | `CPPTRACE_GET_SYMBOLS_WITH_LIBDL` | linux, macos | Libdl uses dynamic export information. Compiling with `-rdynamic` is needed for symbol information to be retrievable. Line numbers won't be retrievable. |
| N/A | `CPPTRACE_GET_SYMBOLS_WITH_NOTHING` | all | No attempt is made to resolve symbols. |
*: Requires installation
One back-end should be used. For MinGW `CPPTRACE_GET_SYMBOLS_WITH_LIBDWARF` and `CPPTRACE_GET_SYMBOLS_WITH_DBGHELP` can
be used in conjunction.
Note for addr2line: By default cmake will resolve an absolute path to addr2line to bake into the library. This path can
be configured with `CPPTRACE_ADDR2LINE_PATH`, or `CPPTRACE_ADDR2LINE_SEARCH_SYSTEM_PATH` can be used to have the library
search the system path for `addr2line` at runtime. This is not the default to prevent against path injection attacks.
**Demangling**
Lastly, depending on other back-ends used a demangler back-end may be needed.
| Library | CMake config | Platforms | Info |
| --------- | -------------------------------- | ------------------- | ---------------------------------------------------------------------------------- |
| cxxabi.h | `CPPTRACE_DEMANGLE_WITH_CXXABI` | Linux, macos, mingw | Should be available everywhere other than [msvc](https://godbolt.org/z/93ca9rcdz). |
| dbghelp.h | `CPPTRACE_DEMANGLE_WITH_WINAPI` | Windows | Demangle with `UnDecorateSymbolName`. |
| N/A | `CPPTRACE_DEMANGLE_WITH_NOTHING` | all | Don't attempt to do anything beyond what the symbol resolution back-end does. |
**More?**
There are plenty more libraries that can be used for unwinding, parsing debug information, and demangling. In the future
more back-ends can be added. Ideally this library can "just work" on systems, without additional installation work.
## Summary of Library Configurations
Summary of all library configuration options:
Back-ends:
- `CPPTRACE_GET_SYMBOLS_WITH_LIBDWARF=On/Off`
- `CPPTRACE_GET_SYMBOLS_WITH_DBGHELP=On/Off`
- `CPPTRACE_GET_SYMBOLS_WITH_LIBBACKTRACE=On/Off`
- `CPPTRACE_GET_SYMBOLS_WITH_ADDR2LINE=On/Off`
- `CPPTRACE_GET_SYMBOLS_WITH_LIBDL=On/Off`
- `CPPTRACE_GET_SYMBOLS_WITH_NOTHING=On/Off`
- `CPPTRACE_UNWIND_WITH_UNWIND=On/Off`
- `CPPTRACE_UNWIND_WITH_LIBUNWIND=On/Off`
- `CPPTRACE_UNWIND_WITH_EXECINFO=On/Off`
- `CPPTRACE_UNWIND_WITH_WINAPI=On/Off`
- `CPPTRACE_UNWIND_WITH_DBGHELP=On/Off`
- `CPPTRACE_UNWIND_WITH_NOTHING=On/Off`
- `CPPTRACE_DEMANGLE_WITH_CXXABI=On/Off`
- `CPPTRACE_DEMANGLE_WITH_WINAPI=On/Off`
- `CPPTRACE_DEMANGLE_WITH_NOTHING=On/Off`
Back-end configuration:
- `CPPTRACE_BACKTRACE_PATH=<string>`: Path to libbacktrace backtrace.h, needed when compiling with clang/
- `CPPTRACE_HARD_MAX_FRAMES=<number>`: Some back-ends write to a fixed-size buffer. This is the size of that buffer.
Default is `400`.
- `CPPTRACE_ADDR2LINE_PATH=<string>`: Specify the absolute path to the addr2line binary for cpptrace to invoke. By
default the config script will search for a binary and use that absolute path (this is to prevent against path
injection).
- `CPPTRACE_ADDR2LINE_SEARCH_SYSTEM_PATH=On/Off`: Specifies whether cpptrace should let the system search the PATH
environment variable directories for the binary.
Other useful configurations:
- `CPPTRACE_BUILD_SHARED=On/Off`: Override for `BUILD_SHARED_LIBS`.
- `CPPTRACE_INCLUDES_WITH_SYSTEM=On/Off`: Marks cpptrace headers as `SYSTEM` which will hide any warnings that aren't
the fault of your project. Defaults to On.
- `CPPTRACE_INSTALL_CMAKEDIR`: Override for the installation path for the cmake configs.
- `CPPTRACE_USE_EXTERNAL_LIBDWARF=On/Off`: Get libdwarf from `find_package` rather than `FetchContent`.
- `CPPTRACE_POSITION_INDEPENDENT_CODE=On/Off`: Compile the library as a position independent code (PIE). Defaults to On.
- `CPPTRACE_STD_FORMAT=On/Off`: Control inclusion of `<format>` and provision of `std::formatter` specializations by
cpptrace.hpp. This can also be controlled with the macro `CPPTRACE_NO_STD_FORMAT`.
Testing:
- `CPPTRACE_BUILD_TESTING` Build small demo and test program
- `CPPTRACE_BUILD_TEST_RDYNAMIC` Use `-rdynamic` when compiling the test program
# Testing Methodology
Cpptrace currently uses integration and functional testing, building and running under every combination of back-end
options. The implementation is based on [github actions matrices][1] and driven by python scripts located in the
[`ci/`](ci/) folder. Testing used to be done by github actions matrices directly, however, launching hundreds of two
second jobs was extremely inefficient. Test outputs are compared against expected outputs located in
[`test/expected/`](test/expected/). Stack trace addresses may point to the address after an instruction depending on the
unwinding back-end, and the python script will check for an exact or near-match accordingly.
[1]: https://docs.github.com/en/actions/using-jobs/using-a-matrix-for-your-jobs
# Notes About the Library
For the most part I'm happy with the state of the library. But I'm sure that there is room for improvement and issues
will exist. If you encounter any issue, please let me know! If you find any pain-points in the library, please let me
know that too.
A note about performance: For handling of DWARF symbols there is a lot of room to explore for performance optimizations
and time-memory tradeoffs. If you find the current implementation is either slow or using too much memory, I'd be happy
to explore some of these options.
A couple things I'd like to improve in the future:
- On Windows when collecting symbols with dbghelp (msvc/clang) parameter types are almost perfect but due to limitations
in dbghelp the library cannot accurately show const and volatile qualifiers or rvalue references (these appear as
pointers).
# FAQ
## What about C++23 `<stacktrace>`?
Some day C++23's `<stacktrace>` will be ubiquitous. And maybe one day the msvc implementation will be acceptable.
The original motivation for cpptrace was to support projects using older C++ standards and as the library has grown its
functionality has extended beyond the standard library's implementation.
Cpptrace provides functionality beyond what the standard library provides and what implementations provide, such as:
- Walking inlined function calls
- Providing a lightweight interface for "raw traces"
- Resolving function parameter types
- Providing traced exception objects
- Providing an API for signal-safe stacktrace generation
- Providing a way to retrieve stack traces from arbitrary exceptions, not just special cpptrace traced exception
objects. This is a feature coming to C++26, but cpptrace provides a solution for C++11.
## What does cpptrace have over other C++ stacktrace libraries?
Other C++ stacktrace libraries, such as boost stacktrace and backward-cpp, fall short when it comes to portability and
ease of use. In testing, I found neither to provide adequate coverage of various environments. Even when they can be
made to work in an environment they require manual configuration from the end-user, possibly requiring manual
installation of third-party dependencies. This is a highly undesirable burden to impose on users, especially when it is
for a software package which just provides diagnostics as opposed to core functionality. Additionally, cpptrace provides
support for resolving inlined calls by default for DWARF symbols (boost does not do this, backward-cpp can do this but
only for some back-ends), better support for resolving full function signatures, and nicer API, among other features.
## I'm getting undefined standard library symbols like `std::__1::basic_string` on MacOS
If you see a linker error along the lines of the following on MacOS then it's highly likely you are mixing standard
library ABIs.
```
Undefined symbols for architecture arm64:
"std::__1::basic_string<char, std::__1::char_traits<char>, std::__1::allocator<char> >::find(char, unsigned long) const", referenced from:
cpptrace::detail::demangle(std::__1::basic_string<char, std::__1::char_traits<char>, std::__1::allocator<char> > const&, bool) in libcpptrace.a(demangle_with_cxxabi.cpp.o)
cpptrace::detail::snippet_manager::build_line_table() in libcpptrace.a(snippet.cpp.o)
```
This can happen when using apple clang to compile cpptrace and gcc to compile your code, or vice versa. The reason is
that apple clang defaults to libc++ and gcc defaults to libstdc++ and these two standard library implementations are not
ABI-compatible. To resolve this, ensure you are compiling both cpptrace and your code with the same standard library by
either using the same compiler for both or using `-stdlib=libc++`/`-stdlib=libstdc++` to control which standard library
is used.
# Contributing
I'm grateful for the help I've received with this library and I welcome contributions! For information on contributing
please refer to [CONTRIBUTING.md](./CONTRIBUTING.md).
# License
This library is under the MIT license.
Cpptrace uses libdwarf on linux, macos, and mingw/cygwin unless configured to use something else. If this library is
statically linked with libdwarf then the library's binary will itself be LGPL.
[P2490R3]: https://www.open-std.org/jtc1/sc22/wg21/docs/papers/2022/p2490r3.html
|
