1
2
3
4
5
6
7
8
9
10
11
12
13
14
15
16
17
18
19
20
21
22
23
24
25
26
27
28
29
30
31
32
33
34
35
36
37
38
39
40
41
42
43
44
45
46
47
48
49
50
51
52
53
54
55
56
57
58
59
60
61
62
63
64
65
66
67
68
69
70
71
72
73
74
75
76
77
78
79
80
81
82
83
84
85
86
87
88
89
90
91
92
93
94
95
96
97
98
99
100
101
102
103
104
105
106
107
108
109
110
111
112
113
114
115
116
117
118
119
120
121
122
123
124
125
126
127
128
129
130
131
132
133
134
135
136
137
138
139
140
141
142
143
144
145
146
147
148
149
150
151
152
153
154
155
156
157
158
159
160
161
162
163
164
165
166
167
168
169
170
171
172
173
174
175
176
177
178
179
180
181
182
183
184
185
186
187
188
189
190
191
192
193
194
195
196
197
198
199
200
201
202
203
204
205
206
207
208
209
210
211
212
213
214
215
216
217
218
219
220
221
222
223
224
225
226
227
228
229
230
231
232
233
234
235
236
237
238
239
240
241
242
243
244
245
246
247
|
# django-prometheus
Export Django monitoring metrics for Prometheus.io
[](https://gitter.im/django-prometheus/community?utm_source=badge&utm_medium=badge&utm_campaign=pr-badge&utm_content=badge)
[](http://badge.fury.io/py/django-prometheus)
[](https://github.com/korfuri/django-prometheus/actions/workflows/ci.yml)
[](https://coveralls.io/github/korfuri/django-prometheus?branch=master)
[](https://pypi.python.org/pypi/django-prometheus)
## Features
This library provides Prometheus metrics for Django related operations:
* Requests & Responses
* Database access done via [Django ORM](https://docs.djangoproject.com/en/3.2/topics/db/)
* Cache access done via [Django Cache framework](https://docs.djangoproject.com/en/3.2/topics/cache/)
## Usage
### Requirements
* Django >= 4.2
* Python 3.9 and above.
### Installation
Install with:
```shell
pip install django-prometheus
```
Or, if you're using a development version cloned from this repository:
```shell
python path-to-where-you-cloned-django-prometheus/setup.py install
```
This will install [prometheus_client](https://github.com/prometheus/client_python) as a dependency.
### Quickstart
In your settings.py:
```python
INSTALLED_APPS = [
...
'django_prometheus',
...
]
MIDDLEWARE = [
'django_prometheus.middleware.PrometheusBeforeMiddleware',
# All your other middlewares go here, including the default
# middlewares like SessionMiddleware, CommonMiddleware,
# CsrfViewmiddleware, SecurityMiddleware, etc.
'django_prometheus.middleware.PrometheusAfterMiddleware',
]
```
In your urls.py:
```python
urlpatterns = [
...
path('', include('django_prometheus.urls')),
]
```
### Configuration
Prometheus uses Histogram based grouping for monitoring latencies. The default
buckets are:
```python
PROMETHEUS_LATENCY_BUCKETS = (0.01, 0.025, 0.05, 0.075, 0.1, 0.25, 0.5, 0.75, 1.0, 2.5, 5.0, 7.5, 10.0, 25.0, 50.0, 75.0, float("inf"),)
```
You can define custom buckets for latency, adding more buckets decreases performance but
increases accuracy: <https://prometheus.io/docs/practices/histograms/>
```python
PROMETHEUS_LATENCY_BUCKETS = (.1, .2, .5, .6, .8, 1.0, 2.0, 3.0, 4.0, 5.0, 6.0, 7.5, 9.0, 12.0, 15.0, 20.0, 30.0, float("inf"))
```
---
You can have a custom namespace for your metrics:
```python
PROMETHEUS_METRIC_NAMESPACE = "project"
```
This will prefix all metrics with `project_` word like this:
```text
project_django_http_requests_total_by_method_total{method="GET"} 1.0
```
### Monitoring your databases
SQLite, MySQL, and PostgreSQL databases can be monitored. Just
replace the `ENGINE` property of your database, replacing
`django.db.backends` with `django_prometheus.db.backends`.
```python
DATABASES = {
'default': {
'ENGINE': 'django_prometheus.db.backends.sqlite3',
'NAME': os.path.join(BASE_DIR, 'db.sqlite3'),
},
}
```
### Monitoring your caches
Filebased, memcached, redis caches can be monitored. Just replace
the cache backend to use the one provided by django_prometheus
`django.core.cache.backends` with `django_prometheus.cache.backends`.
```python
CACHES = {
'default': {
'BACKEND': 'django_prometheus.cache.backends.filebased.FileBasedCache',
'LOCATION': '/var/tmp/django_cache',
}
}
```
### Monitoring your models
You may want to monitor the creation/deletion/update rate for your
model. This can be done by adding a mixin to them. This is safe to do
on existing models (it does not require a migration).
If your model is:
```python
class Dog(models.Model):
name = models.CharField(max_length=100, unique=True)
breed = models.CharField(max_length=100, blank=True, null=True)
age = models.PositiveIntegerField(blank=True, null=True)
```
Just add the `ExportModelOperationsMixin` as such:
```python
from django_prometheus.models import ExportModelOperationsMixin
class Dog(ExportModelOperationsMixin('dog'), models.Model):
name = models.CharField(max_length=100, unique=True)
breed = models.CharField(max_length=100, blank=True, null=True)
age = models.PositiveIntegerField(blank=True, null=True)
```
This will export 3 metrics, `django_model_inserts_total{model="dog"}`,
`django_model_updates_total{model="dog"}` and
`django_model_deletes_total{model="dog"}`.
Note that the exported metrics are counters of creations,
modifications and deletions done in the current process. They are not
gauges of the number of objects in the model.
Starting with Django 1.7, migrations are also monitored. Two gauges
are exported, `django_migrations_applied_by_connection` and
`django_migrations_unapplied_by_connection`. You may want to alert if
there are unapplied migrations.
If you want to disable the Django migration metrics, set the
`PROMETHEUS_EXPORT_MIGRATIONS` setting to False.
### Monitoring and aggregating the metrics
Prometheus is quite easy to set up. An example prometheus.conf to
scrape `127.0.0.1:8001` can be found in `examples/prometheus`.
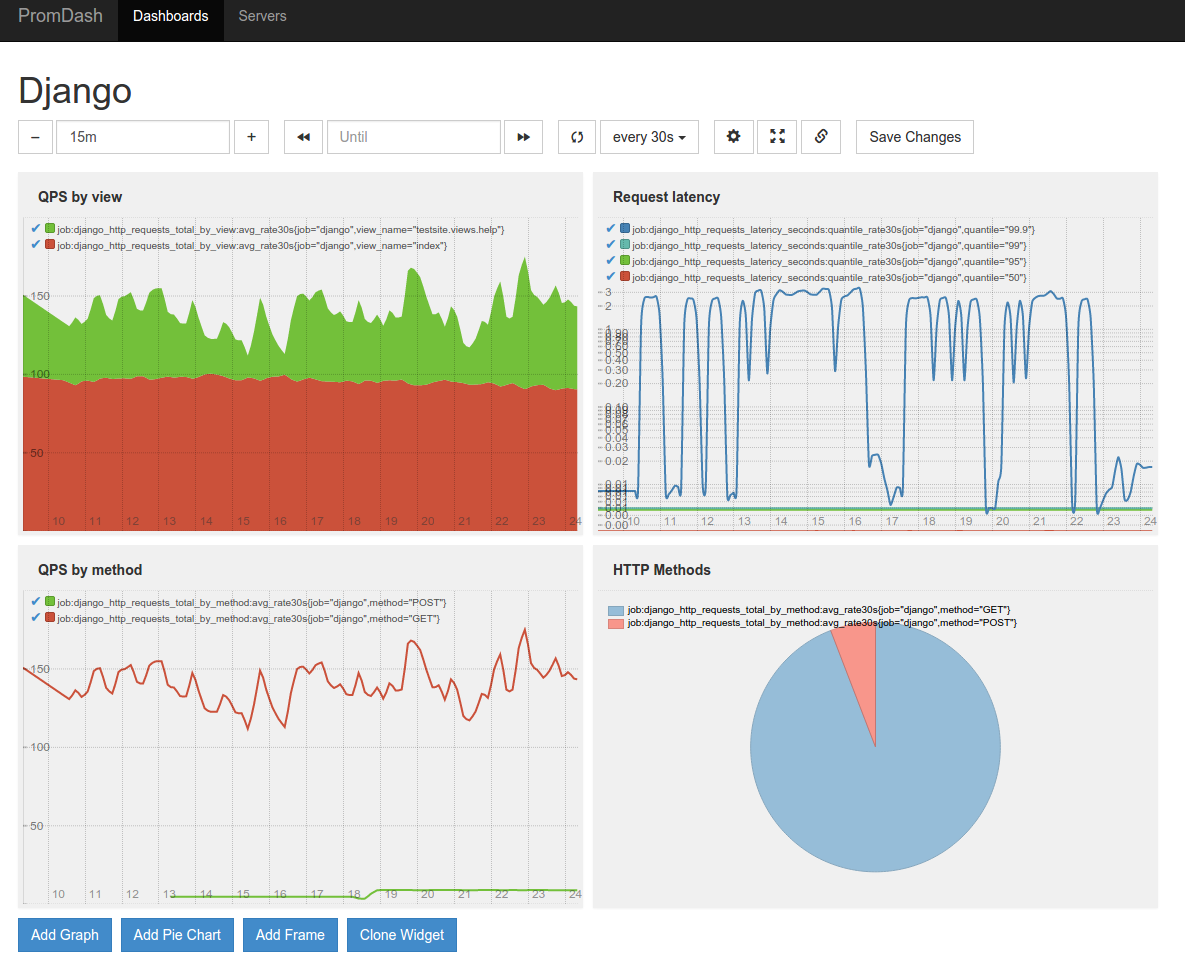
Here's an example of a PromDash displaying some of the metrics
collected by django-prometheus:
## Adding your own metrics
You can add application-level metrics in your code by using
[prometheus_client](https://github.com/prometheus/client_python)
directly. The exporter is global and will pick up your metrics.
To add metrics to the Django internals, the easiest way is to extend
django-prometheus' classes. Please consider contributing your metrics,
pull requests are welcome. Make sure to read the Prometheus best
practices on
[instrumentation](http://prometheus.io/docs/practices/instrumentation/)
and [naming](http://prometheus.io/docs/practices/naming/).
## Importing Django Prometheus using only local settings
If you wish to use Django Prometheus but are not able to change
the code base, it's possible to have all the default metrics by
modifying only the settings.
First step is to inject prometheus' middlewares and to add
django_prometheus in INSTALLED_APPS
```python
MIDDLEWARE = \
['django_prometheus.middleware.PrometheusBeforeMiddleware'] + \
MIDDLEWARE + \
['django_prometheus.middleware.PrometheusAfterMiddleware']
INSTALLED_APPS += ['django_prometheus']
```
Second step is to create the /metrics end point, for that we need
another file (called urls_prometheus_wrapper.py in this example) that
will wraps the apps URLs and add one on top:
```python
from django.urls import include, path
urlpatterns = []
urlpatterns.append(path('prometheus/', include('django_prometheus.urls')))
urlpatterns.append(path('', include('myapp.urls')))
```
This file will add a "/prometheus/metrics" end point to the URLs of django
that will export the metrics (replace myapp by your project name).
Then we inject the wrapper in settings:
```python
ROOT_URLCONF = "graphite.urls_prometheus_wrapper"
```
## Adding custom labels to middleware (request/response) metrics
You can add application specific labels to metrics reported by the django-prometheus middleware.
This involves extending the classes defined in middleware.py.
* Extend the Metrics class and override the `register_metric` method to add the application specific labels.
* Extend middleware classes, set the metrics_cls class attribute to the the extended metric class and override the label_metric method to attach custom metrics.
See implementation example in [the test app](django_prometheus/tests/end2end/testapp/test_middleware_custom_labels.py#L19-L46)
|
