1
2
3
4
5
6
7
8
9
10
11
12
13
14
15
16
17
18
19
20
21
22
23
24
25
26
27
28
29
30
31
32
33
34
35
36
37
38
39
40
41
42
43
|
---
stage: Plan
group: Optimize
info: To determine the technical writer assigned to the Stage/Group associated with this page, see https://handbook.gitlab.com/handbook/product/ux/technical-writing/#assignments
---
# Usage trends
DETAILS:
**Tier:** Free, Premium, Ultimate
**Offering:** GitLab.com, Self-managed
Usage trends give you an overview of how much data your instance contains, and how quickly this volume is changing over time.
Usage trends data refreshes daily.
## View usage trends
To view usage trends:
1. On the left sidebar, at the bottom, select **Admin**.
1. Select **Analytics > Usage trends**.
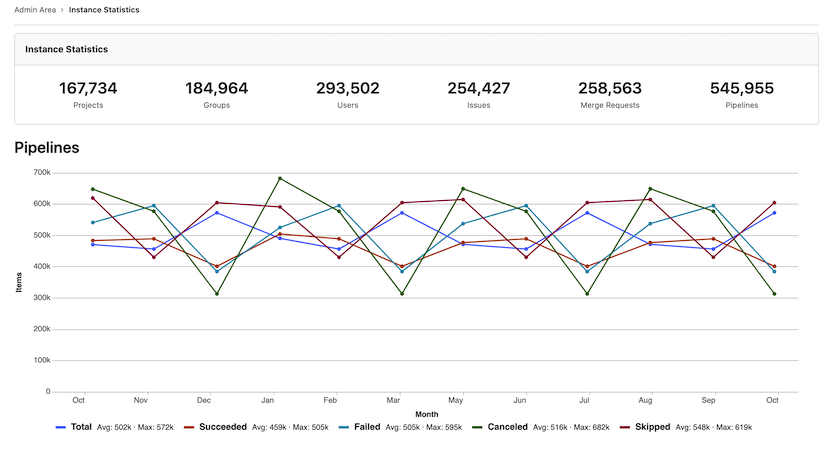
## Total counts
At the top of the page, usage trends show total counts for:
- Users
- Projects
- Groups
- Issues
- Merge requests
- Pipelines
These figures can be useful for understanding how much data your instance contains in total.
## Past year trend charts
Usage trends also display line charts that show total counts per month, over the past 12 months,
in the categories shown in [Total counts](#total-counts).
These charts help you visualize how rapidly these records are being created on your instance.
|
