1
2
3
4
5
6
7
8
9
10
11
12
13
14
15
16
17
18
19
20
21
22
23
24
25
26
27
28
29
30
31
32
33
34
35
36
37
38
39
40
41
42
43
44
45
46
47
48
49
50
51
52
53
54
55
56
57
58
59
60
61
62
63
64
65
66
67
68
69
70
71
72
73
74
75
76
77
78
79
80
81
82
83
84
85
86
87
88
89
90
91
92
93
94
95
96
97
98
99
100
101
102
103
104
105
106
107
108
109
110
111
112
113
114
115
116
117
118
119
120
121
122
123
124
125
126
127
128
129
130
131
132
133
134
135
136
137
138
139
140
141
142
143
144
145
146
147
148
149
150
151
152
153
154
155
156
157
158
159
160
161
162
163
164
165
166
167
168
169
170
171
172
173
174
175
176
177
178
179
180
181
182
183
184
185
186
187
188
189
190
191
192
193
194
195
196
197
198
199
200
201
202
203
204
205
206
207
208
209
210
211
212
213
214
215
216
217
218
219
220
221
222
223
224
225
226
227
228
229
230
231
232
233
234
235
236
237
238
239
240
241
242
243
244
245
246
247
248
249
250
251
252
253
254
255
256
257
258
259
260
261
262
263
264
265
266
267
268
269
270
271
272
273
274
275
276
277
278
279
280
281
282
283
284
285
286
287
288
289
290
291
292
293
294
295
296
297
298
299
300
301
302
303
304
305
306
307
308
309
310
311
312
313
314
315
316
317
318
319
320
321
322
323
324
325
326
327
328
329
330
331
332
333
334
335
336
337
338
339
340
341
342
343
344
345
346
347
348
349
350
351
352
353
354
355
356
357
358
359
360
361
362
363
364
365
366
367
368
369
370
371
372
373
374
375
376
377
378
379
380
381
382
383
384
385
386
387
388
389
390
391
392
393
394
395
396
397
398
399
400
401
402
403
404
405
406
407
408
409
410
411
412
413
414
415
416
417
418
419
420
421
422
423
424
425
426
427
428
429
430
431
432
433
434
435
436
437
438
439
440
441
442
443
444
445
446
447
448
449
450
451
452
453
454
455
456
457
458
459
460
461
462
463
464
465
466
467
468
469
470
471
472
473
474
475
476
477
478
479
480
481
482
483
484
485
486
487
488
489
490
491
492
493
494
495
496
497
498
499
500
501
502
503
504
505
506
507
508
509
510
511
512
513
514
515
516
517
518
519
520
521
522
523
524
525
526
527
528
529
530
531
532
533
534
535
536
537
538
539
540
541
542
543
544
545
546
547
548
549
550
551
552
553
554
555
556
557
558
559
560
561
562
563
564
565
566
567
568
569
570
571
572
573
574
575
576
577
578
579
580
581
582
583
584
585
586
587
588
589
590
591
592
593
594
595
596
597
598
599
600
601
602
603
604
605
606
607
608
609
610
611
612
613
614
615
616
617
618
619
620
621
622
623
624
625
626
627
628
629
630
631
632
633
634
635
636
|
---
stage: Systems
group: Distribution
info: To determine the technical writer assigned to the Stage/Group associated with this page, see https://handbook.gitlab.com/handbook/product/ux/technical-writing/#assignments
---
# Troubleshooting Sidekiq
DETAILS:
**Tier:** Free, Premium, Ultimate
**Offering:** Self-managed
Sidekiq is the background job processor GitLab uses to asynchronously run
tasks. When things go wrong it can be difficult to troubleshoot. These
situations also tend to be high-pressure because a production system job queue
may be filling up. Users notice when this happens because new branches
may not show up and merge requests may not be updated. The following are some
troubleshooting steps to help you diagnose the bottleneck.
GitLab administrators/users should consider working through these
debug steps with GitLab Support so the backtraces can be analyzed by our team.
It may reveal a bug or necessary improvement in GitLab.
In any of the backtraces, be wary of suspecting cases where every
thread appears to be waiting in the database, Redis, or waiting to acquire
a mutex. This **may** mean there's contention in the database, for example,
but look for one thread that is different than the rest. This other thread
may be using all available CPU, or have a Ruby Global Interpreter Lock,
preventing other threads from continuing.
## Log arguments to Sidekiq jobs
Some arguments passed to Sidekiq jobs are logged by default.
To avoid logging sensitive information (for instance, password reset tokens),
GitLab logs numeric arguments for all workers, with overrides for some specific
workers where their arguments are not sensitive.
Example log output:
```json
{"severity":"INFO","time":"2020-06-08T14:37:37.892Z","class":"AdminEmailsWorker","args":["[FILTERED]","[FILTERED]","[FILTERED]"],"retry":3,"queue":"admin_emails","backtrace":true,"jid":"9e35e2674ac7b12d123e13cc","created_at":"2020-06-08T14:37:37.373Z","meta.user":"root","meta.caller_id":"Admin::EmailsController#create","correlation_id":"37D3lArJmT1","uber-trace-id":"2d942cc98cc1b561:6dc94409cfdd4d77:9fbe19bdee865293:1","enqueued_at":"2020-06-08T14:37:37.410Z","pid":65011,"message":"AdminEmailsWorker JID-9e35e2674ac7b12d123e13cc: done: 0.48085 sec","job_status":"done","scheduling_latency_s":0.001012,"redis_calls":9,"redis_duration_s":0.004608,"redis_read_bytes":696,"redis_write_bytes":6141,"duration_s":0.48085,"cpu_s":0.308849,"completed_at":"2020-06-08T14:37:37.892Z","db_duration_s":0.010742}
{"severity":"INFO","time":"2020-06-08T14:37:37.894Z","class":"ActiveJob::QueueAdapters::SidekiqAdapter::JobWrapper","wrapped":"ActionMailer::MailDeliveryJob","queue":"mailers","args":["[FILTERED]"],"retry":3,"backtrace":true,"jid":"e47a4f6793d475378432e3c8","created_at":"2020-06-08T14:37:37.884Z","meta.user":"root","meta.caller_id":"AdminEmailsWorker","correlation_id":"37D3lArJmT1","uber-trace-id":"2d942cc98cc1b561:29344de0f966446d:5c3b0e0e1bef987b:1","enqueued_at":"2020-06-08T14:37:37.885Z","pid":65011,"message":"ActiveJob::QueueAdapters::SidekiqAdapter::JobWrapper JID-e47a4f6793d475378432e3c8: start","job_status":"start","scheduling_latency_s":0.009473}
{"severity":"INFO","time":"2020-06-08T14:39:50.648Z","class":"NewIssueWorker","args":["455","1"],"retry":3,"queue":"new_issue","backtrace":true,"jid":"a24af71f96fd129ec47f5d1e","created_at":"2020-06-08T14:39:50.643Z","meta.user":"root","meta.project":"h5bp/html5-boilerplate","meta.root_namespace":"h5bp","meta.caller_id":"Projects::IssuesController#create","correlation_id":"f9UCZHqhuP7","uber-trace-id":"28f65730f99f55a3:a5d2b62dec38dffc:48ddd092707fa1b7:1","enqueued_at":"2020-06-08T14:39:50.646Z","pid":65011,"message":"NewIssueWorker JID-a24af71f96fd129ec47f5d1e: start","job_status":"start","scheduling_latency_s":0.001144}
```
When using [Sidekiq JSON logging](../logs/index.md#sidekiqlog),
arguments logs are limited to a maximum size of 10 kilobytes of text;
any arguments after this limit are discarded and replaced with a
single argument containing the string `"..."`.
You can set `SIDEKIQ_LOG_ARGUMENTS` [environment variable](https://docs.gitlab.com/omnibus/settings/environment-variables.html)
to `0` (false) to disable argument logging.
Example:
```ruby
gitlab_rails['env'] = {"SIDEKIQ_LOG_ARGUMENTS" => "0"}
```
## Investigating Sidekiq queue backlogs or slow performance
Symptoms of slow Sidekiq performance include problems with merge request status updates,
and delays before CI pipelines start running.
Potential causes include:
- The GitLab instance may need more Sidekiq workers. By default, a single-node Linux package installation
runs one worker, restricting the execution of Sidekiq jobs to a maximum of one CPU core.
[Read more about running multiple Sidekiq workers](extra_sidekiq_processes.md).
- The instance is configured with more Sidekiq workers, but most of the extra workers are
not configured to run any job that is queued. This can result in a backlog of jobs
when the instance is busy, if the workload has changed in the months or years since
the workers were configured, or as a result of GitLab product changes.
Gather data on the state of the Sidekiq workers with the following Ruby script.
1. Create the script:
```ruby
cat > /var/opt/gitlab/sidekiqcheck.rb <<EOF
require 'sidekiq/monitor'
Sidekiq::Monitor::Status.new.display('overview')
Sidekiq::Monitor::Status.new.display('processes'); nil
Sidekiq::Monitor::Status.new.display('queues'); nil
puts "----------- workers ----------- "
workers = Sidekiq::Workers.new
workers.each do |_process_id, _thread_id, work|
pp work
end
puts "----------- Queued Jobs ----------- "
Sidekiq::Queue.all.each do |queue|
queue.each do |job|
pp job
end
end ;nil
puts "----------- done! ----------- "
EOF
```
1. Execute and capture the output:
```shell
sudo gitlab-rails runner /var/opt/gitlab/sidekiqcheck.rb > /tmp/sidekiqcheck_$(date '+%Y%m%d-%H:%M').out
```
If the performance issue is intermittent:
- Run this in a cron job every five minutes. Write the files to a location with enough space: allow for at least 500 KB per file.
```shell
cat > /etc/cron.d/sidekiqcheck <<EOF
*/5 * * * * root /opt/gitlab/bin/gitlab-rails runner /var/opt/gitlab/sidekiqcheck.rb > /tmp/sidekiqcheck_$(date '+\%Y\%m\%d-\%H:\%M').out 2>&1
EOF
```
- Refer back to the data to see what went wrong.
1. Analyze the output. The following commands assume that you have a directory of output files.
1. `grep 'Busy: ' *` shows how many jobs were being run. `grep 'Enqueued: ' *`
shows the backlog of work at that time.
1. Look at the number of busy threads across the workers in samples where Sidekiq is under load:
```shell
ls | while read f ; do if grep -q 'Enqueued: 0' $f; then :
else echo $f; egrep 'Busy:|Enqueued:|---- Processes' $f
grep 'Threads:' $f ; fi
done | more
```
Example output:
```plaintext
sidekiqcheck_20221024-14:00.out
Busy: 47
Enqueued: 363
---- Processes (13) ----
Threads: 30 (0 busy)
Threads: 30 (0 busy)
Threads: 30 (0 busy)
Threads: 30 (0 busy)
Threads: 23 (0 busy)
Threads: 30 (0 busy)
Threads: 30 (0 busy)
Threads: 30 (0 busy)
Threads: 30 (0 busy)
Threads: 30 (0 busy)
Threads: 30 (0 busy)
Threads: 30 (24 busy)
Threads: 30 (23 busy)
```
- In this output file, 47 threads were busy, and there was a backlog of 363 jobs.
- Of the 13 worker processes, only two were busy.
- This indicates that the other workers are configured too specifically.
- Look at the full output to work out which workers were busy.
Correlate with your `sidekiq_queues` configuration in `gitlab.rb`.
- An overloaded single-worker environment might look like this:
```plaintext
sidekiqcheck_20221024-14:00.out
Busy: 25
Enqueued: 363
---- Processes (1) ----
Threads: 25 (25 busy)
```
1. Look at the `---- Queues (xxx) ----` section of the output file to
determine what jobs were queued up at the time.
1. The files also include low level details about the state of Sidekiq at the time.
This could be useful for identifying where spikes in workload are coming from.
- The `----------- workers -----------` section details the jobs that make up the
`Busy` count in the summary.
- The `----------- Queued Jobs -----------` section provides details on
jobs that are `Enqueued`.
## Thread dump
Send the Sidekiq process ID the `TTIN` signal to output thread
backtraces in the log file.
```shell
kill -TTIN <sidekiq_pid>
```
Check in `/var/log/gitlab/sidekiq/current` or `$GITLAB_HOME/log/sidekiq.log` for
the backtrace output. The backtraces are lengthy and generally start with
several `WARN` level messages. Here's an example of a single thread's backtrace:
```plaintext
2016-04-13T06:21:20.022Z 31517 TID-orn4urby0 WARN: ActiveRecord::RecordNotFound: Couldn't find Note with 'id'=3375386
2016-04-13T06:21:20.022Z 31517 TID-orn4urby0 WARN: /opt/gitlab/embedded/service/gem/ruby/2.1.0/gems/activerecord-4.2.5.2/lib/active_record/core.rb:155:in `find'
/opt/gitlab/embedded/service/gitlab-rails/app/workers/new_note_worker.rb:7:in `perform'
/opt/gitlab/embedded/service/gem/ruby/2.1.0/gems/sidekiq-4.0.1/lib/sidekiq/processor.rb:150:in `execute_job'
/opt/gitlab/embedded/service/gem/ruby/2.1.0/gems/sidekiq-4.0.1/lib/sidekiq/processor.rb:132:in `block (2 levels) in process'
/opt/gitlab/embedded/service/gem/ruby/2.1.0/gems/sidekiq-4.0.1/lib/sidekiq/middleware/chain.rb:127:in `block in invoke'
/opt/gitlab/embedded/service/gitlab-rails/lib/gitlab/sidekiq_middleware/memory_killer.rb:17:in `call'
/opt/gitlab/embedded/service/gem/ruby/2.1.0/gems/sidekiq-4.0.1/lib/sidekiq/middleware/chain.rb:129:in `block in invoke'
/opt/gitlab/embedded/service/gitlab-rails/lib/gitlab/sidekiq_middleware/arguments_logger.rb:6:in `call'
...
```
In some cases Sidekiq may be hung and unable to respond to the `TTIN` signal.
Move on to other troubleshooting methods if this happens.
## Ruby profiling with `rbspy`
[rbspy](https://rbspy.github.io) is an easy to use and low-overhead Ruby profiler that can be used to create
flamegraph-style diagrams of CPU usage by Ruby processes.
No changes to GitLab are required to use it and it has no dependencies. To install it:
1. Download the binary from the [`rbspy` releases page](https://github.com/rbspy/rbspy/releases).
1. Make the binary executable.
To profile a Sidekiq worker for one minute, run:
```shell
sudo ./rbspy record --pid <sidekiq_pid> --duration 60 --file /tmp/sidekiq_profile.svg
```
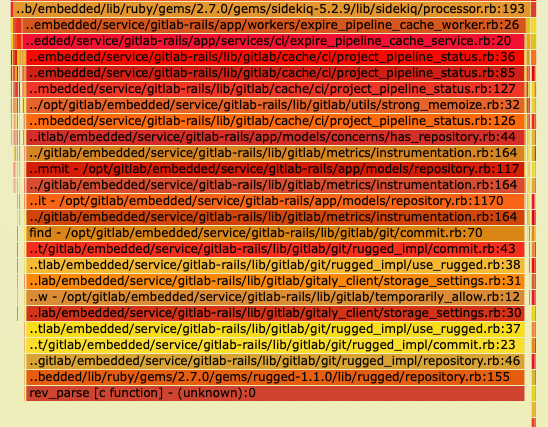
In this example of a flamegraph generated by `rbspy`, almost all of the Sidekiq process's time is spent in `rev_parse`, a native C
function in Rugged. In the stack, we can see `rev_parse` is being called by the `ExpirePipelineCacheWorker`.
`rbspy` requires additional [capabilities](https://man7.org/linux/man-pages/man7/capabilities.7.html)
in [containerized environments](https://rbspy.github.io/using-rbspy/index.html#containers).
It requires at least the `SYS_PTRACE` capability, otherwise it terminates with a `permission denied` error.
::Tabs
::: TabTitle Kubernetes
```yaml
securityContext:
capabilities:
add:
- SYS_PTRACE
```
:::TabTitle Docker
```shell
docker run --cap-add SYS_PTRACE [...]
```
:::TabTitle Docker Compose
```yaml
services:
ruby_container_name:
...
cap_add:
- SYS_PTRACE
```
::EndTabs
## Process profiling with `perf`
Linux has a process profiling tool called `perf` that is helpful when a certain
process is eating up a lot of CPU. If you see high CPU usage and Sidekiq isn't
responding to the `TTIN` signal, this is a good next step.
If `perf` is not installed on your system, install it with `apt-get` or `yum`:
```shell
# Debian
sudo apt-get install linux-tools
# Ubuntu (may require these additional Kernel packages)
sudo apt-get install linux-tools-common linux-tools-generic linux-tools-`uname -r`
# Red Hat/CentOS
sudo yum install perf
```
Run `perf` against the Sidekiq PID:
```shell
sudo perf record -p <sidekiq_pid>
```
Let this run for 30-60 seconds and then press Ctrl-C. Then view the `perf` report:
```shell
$ sudo perf report
# Sample output
Samples: 348K of event 'cycles', Event count (approx.): 280908431073
97.69% ruby nokogiri.so [.] xmlXPathNodeSetMergeAndClear
0.18% ruby libruby.so.2.1.0 [.] objspace_malloc_increase
0.12% ruby libc-2.12.so [.] _int_malloc
0.10% ruby libc-2.12.so [.] _int_free
```
Above you see sample output from a `perf` report. It shows that 97% of the CPU is
being spent inside Nokogiri and `xmlXPathNodeSetMergeAndClear`. For something
this obvious you should then go investigate what job in GitLab would use
Nokogiri and XPath. Combine with `TTIN` or `gdb` output to show the
corresponding Ruby code where this is happening.
## The GNU Project Debugger (`gdb`)
`gdb` can be another effective tool for debugging Sidekiq. It gives you a little
more interactive way to look at each thread and see what's causing problems.
Attaching to a process with `gdb` suspends the standard operation
of the process (Sidekiq does not process jobs while `gdb` is attached).
Start by attaching to the Sidekiq PID:
```shell
gdb -p <sidekiq_pid>
```
Then gather information on all the threads:
```plaintext
info threads
# Example output
30 Thread 0x7fe5fbd63700 (LWP 26060) 0x0000003f7cadf113 in poll () from /lib64/libc.so.6
29 Thread 0x7fe5f2b3b700 (LWP 26533) 0x0000003f7ce0b68c in pthread_cond_wait@@GLIBC_2.3.2 () from /lib64/libpthread.so.0
28 Thread 0x7fe5f2a3a700 (LWP 26534) 0x0000003f7ce0ba5e in pthread_cond_timedwait@@GLIBC_2.3.2 () from /lib64/libpthread.so.0
27 Thread 0x7fe5f2939700 (LWP 26535) 0x0000003f7ce0b68c in pthread_cond_wait@@GLIBC_2.3.2 () from /lib64/libpthread.so.0
26 Thread 0x7fe5f2838700 (LWP 26537) 0x0000003f7ce0b68c in pthread_cond_wait@@GLIBC_2.3.2 () from /lib64/libpthread.so.0
25 Thread 0x7fe5f2737700 (LWP 26538) 0x0000003f7ce0b68c in pthread_cond_wait@@GLIBC_2.3.2 () from /lib64/libpthread.so.0
24 Thread 0x7fe5f2535700 (LWP 26540) 0x0000003f7ce0b68c in pthread_cond_wait@@GLIBC_2.3.2 () from /lib64/libpthread.so.0
23 Thread 0x7fe5f2434700 (LWP 26541) 0x0000003f7ce0b68c in pthread_cond_wait@@GLIBC_2.3.2 () from /lib64/libpthread.so.0
22 Thread 0x7fe5f2232700 (LWP 26543) 0x0000003f7ce0b68c in pthread_cond_wait@@GLIBC_2.3.2 () from /lib64/libpthread.so.0
21 Thread 0x7fe5f2131700 (LWP 26544) 0x00007fe5f7b570f0 in xmlXPathNodeSetMergeAndClear ()
from /opt/gitlab/embedded/service/gem/ruby/2.1.0/gems/nokogiri-1.6.7.2/lib/nokogiri/nokogiri.so
...
```
If you see a suspicious thread, like the Nokogiri one above, you may want
to get more information:
```plaintext
thread 21
bt
# Example output
#0 0x00007ff0d6afe111 in xmlXPathNodeSetMergeAndClear () from /opt/gitlab/embedded/service/gem/ruby/2.1.0/gems/nokogiri-1.6.7.2/lib/nokogiri/nokogiri.so
#1 0x00007ff0d6b0b836 in xmlXPathNodeCollectAndTest () from /opt/gitlab/embedded/service/gem/ruby/2.1.0/gems/nokogiri-1.6.7.2/lib/nokogiri/nokogiri.so
#2 0x00007ff0d6b09037 in xmlXPathCompOpEval () from /opt/gitlab/embedded/service/gem/ruby/2.1.0/gems/nokogiri-1.6.7.2/lib/nokogiri/nokogiri.so
#3 0x00007ff0d6b09017 in xmlXPathCompOpEval () from /opt/gitlab/embedded/service/gem/ruby/2.1.0/gems/nokogiri-1.6.7.2/lib/nokogiri/nokogiri.so
#4 0x00007ff0d6b092e0 in xmlXPathCompOpEval () from /opt/gitlab/embedded/service/gem/ruby/2.1.0/gems/nokogiri-1.6.7.2/lib/nokogiri/nokogiri.so
#5 0x00007ff0d6b0bc37 in xmlXPathRunEval () from /opt/gitlab/embedded/service/gem/ruby/2.1.0/gems/nokogiri-1.6.7.2/lib/nokogiri/nokogiri.so
#6 0x00007ff0d6b0be5f in xmlXPathEvalExpression () from /opt/gitlab/embedded/service/gem/ruby/2.1.0/gems/nokogiri-1.6.7.2/lib/nokogiri/nokogiri.so
#7 0x00007ff0d6a97dc3 in evaluate (argc=2, argv=0x1022d058, self=<value optimized out>) at xml_xpath_context.c:221
#8 0x00007ff0daeab0ea in vm_call_cfunc_with_frame (th=0x1022a4f0, reg_cfp=0x1032b810, ci=<value optimized out>) at vm_insnhelper.c:1510
```
To output a backtrace from all threads at once:
```plaintext
set pagination off
thread apply all bt
```
Once you're done debugging with `gdb`, be sure to detach from the process and
exit:
```plaintext
detach
exit
```
## Sidekiq kill signals
TTIN was described above as the signal to print backtraces for logging, however
Sidekiq responds to other signals as well. For example, TSTP and TERM can be used
to gracefully shut Sidekiq down, see
[the Sidekiq Signals docs](https://github.com/mperham/sidekiq/wiki/Signals#ttin).
## Check for blocking queries
Sometimes the speed at which Sidekiq processes jobs can be so fast that it can
cause database contention. Check for blocking queries when backtraces above
show that many threads are stuck in the database adapter.
The PostgreSQL wiki has details on the query you can run to see blocking
queries. The query is different based on PostgreSQL version. See
[Lock Monitoring](https://wiki.postgresql.org/wiki/Lock_Monitoring) for
the query details.
## Managing Sidekiq queues
It is possible to use [Sidekiq API](https://github.com/mperham/sidekiq/wiki/API)
to perform a number of troubleshooting steps on Sidekiq.
These are the administrative commands and it should only be used if currently
administration interface is not suitable due to scale of installation.
All these commands should be run using `gitlab-rails console`.
### View the queue size
```ruby
Sidekiq::Queue.new("pipeline_processing:build_queue").size
```
### Enumerate all enqueued jobs
```ruby
queue = Sidekiq::Queue.new("chaos:chaos_sleep")
queue.each do |job|
# job.klass # => 'MyWorker'
# job.args # => [1, 2, 3]
# job.jid # => jid
# job.queue # => chaos:chaos_sleep
# job["retry"] # => 3
# job.item # => {
# "class"=>"Chaos::SleepWorker",
# "args"=>[1000],
# "retry"=>3,
# "queue"=>"chaos:chaos_sleep",
# "backtrace"=>true,
# "queue_namespace"=>"chaos",
# "jid"=>"39bc482b823cceaf07213523",
# "created_at"=>1566317076.266069,
# "correlation_id"=>"c323b832-a857-4858-b695-672de6f0e1af",
# "enqueued_at"=>1566317076.26761},
# }
# job.delete if job.jid == 'abcdef1234567890'
end
```
### Enumerate currently running jobs
```ruby
workers = Sidekiq::Workers.new
workers.each do |process_id, thread_id, work|
# process_id is a unique identifier per Sidekiq process
# thread_id is a unique identifier per thread
# work is a Hash which looks like:
# {"queue"=>"chaos:chaos_sleep",
# "payload"=>
# { "class"=>"Chaos::SleepWorker",
# "args"=>[1000],
# "retry"=>3,
# "queue"=>"chaos:chaos_sleep",
# "backtrace"=>true,
# "queue_namespace"=>"chaos",
# "jid"=>"b2a31e3eac7b1a99ff235869",
# "created_at"=>1566316974.9215662,
# "correlation_id"=>"e484fb26-7576-45f9-bf21-b99389e1c53c",
# "enqueued_at"=>1566316974.9229589},
# "run_at"=>1566316974}],
end
```
### Remove Sidekiq jobs for given parameters (destructive)
The general method to kill jobs conditionally is the following command, which
removes jobs that are queued but not started. Running jobs cannot be killed.
```ruby
queue = Sidekiq::Queue.new('<queue name>')
queue.each { |job| job.delete if <condition>}
```
Have a look at the section below for cancelling running jobs.
In the method above, `<queue-name>` is the name of the queue that contains the jobs you want to delete and `<condition>` decides which jobs get deleted.
Commonly, `<condition>` references the job arguments, which depend on the type of job in question. To find the arguments for a specific queue, you can have a look at the `perform` function of the related worker file, commonly found at `/app/workers/<queue-name>_worker.rb`.
For example, `repository_import` has `project_id` as the job argument, while `update_merge_requests` has `project_id, user_id, oldrev, newrev, ref`.
Arguments need to be referenced by their sequence ID using `job.args[<id>]` because `job.args` is a list of all arguments provided to the Sidekiq job.
Here are some examples:
```ruby
queue = Sidekiq::Queue.new('update_merge_requests')
# In this example, we want to remove any update_merge_requests jobs
# for the Project with ID 125 and ref `ref/heads/my_branch`
queue.each { |job| job.delete if job.args[0] == 125 and job.args[4] == 'ref/heads/my_branch' }
```
```ruby
# Cancelling jobs like: `RepositoryImportWorker.new.perform_async(100)`
id_list = [100]
queue = Sidekiq::Queue.new('repository_import')
queue.each do |job|
job.delete if id_list.include?(job.args[0])
end
```
### Remove specific job ID (destructive)
```ruby
queue = Sidekiq::Queue.new('repository_import')
queue.each do |job|
job.delete if job.jid == 'my-job-id'
end
```
## Canceling running jobs (destructive)
This is highly risky operation and use it as last resort.
Doing that might result in data corruption, as the job
is interrupted mid-execution and it is not guaranteed
that proper rollback of transactions is implemented.
```ruby
Gitlab::SidekiqDaemon::Monitor.cancel_job('job-id')
```
> This requires the Sidekiq to be run with `SIDEKIQ_MONITOR_WORKER=1`
> environment variable.
To perform of the interrupt we use `Thread.raise` which
has number of drawbacks, as mentioned in [Why Ruby's Timeout is dangerous (and Thread.raise is terrifying)](https://jvns.ca/blog/2015/11/27/why-rubys-timeout-is-dangerous-and-thread-dot-raise-is-terrifying/):
> This is where the implications get interesting, and terrifying. This means that an exception can get raised:
>
> - during a network request (ok, as long as the surrounding code is prepared to catch Timeout::Error)
> - during the cleanup for the network request
> - during a rescue block
> - while creating an object to save to the database afterwards
> - in any of your code, regardless of whether it could have possibly raised an exception before
>
> Nobody writes code to defend against an exception being raised on literally any line. That's not even possible. So Thread.raise is basically like a sneak attack on your code that could result in almost anything. It would probably be okay if it were pure-functional code that did not modify any state. But this is Ruby, so that's unlikely :)
## Manually trigger a cron job
By visiting `/admin/background_jobs`, you can look into what jobs are scheduled/running/pending on your instance.
You can trigger a cron job from the UI by selecting the "Enqueue Now" button. To trigger a cron job programmatically first open a [Rails console](../operations/rails_console.md).
To find the cron job you want to test:
```ruby
job = Sidekiq::Cron::Job.find('job-name')
# get status of job:
job.status
# enqueue job right now!
job.enque!
```
For example, to trigger the `update_all_mirrors_worker` cron job that updates the repository mirrors:
```ruby
irb(main):001:0> job = Sidekiq::Cron::Job.find('update_all_mirrors_worker')
=>
#<Sidekiq::Cron::Job:0x00007f147f84a1d0
...
irb(main):002:0> job.status
=> "enabled"
irb(main):003:0> job.enque!
=> 257
```
The list of available jobs can be found in the [workers](https://gitlab.com/gitlab-org/gitlab/-/tree/master/app/workers) directory.
For more information about Sidekiq jobs, see the [Sidekiq-cron](https://github.com/sidekiq-cron/sidekiq-cron#work-with-job) documentation.
## Disabling cron jobs
You can disable any Sidekiq cron jobs by visiting the [Monitoring section in the **Admin** area](../admin_area.md#monitoring-section). You can also perform the same action using the command line and [Rails Runner](../operations/rails_console.md#using-the-rails-runner).
To disable all cron jobs:
```shell
sudo gitlab-rails runner 'Sidekiq::Cron::Job.all.map(&:disable!)'
```
To enable all cron jobs:
```shell
sudo gitlab-rails runner 'Sidekiq::Cron::Job.all.map(&:enable!)'
```
If you wish to enable only a subset of the jobs at a time you can use name matching. For example, to enable only jobs with `geo` in the name:
```shell
sudo gitlab-rails runner 'Sidekiq::Cron::Job.all.select{ |j| j.name.match("geo") }.map(&:disable!)'
```
## Clearing a Sidekiq job deduplication idempotency key
Occasionally, jobs that are expected to run (for example, cron jobs) are observed to not run at all. When checking the logs, there might be instances where jobs are seen to not run with a `"job_status": "deduplicated"`.
This can happen when a job failed and the idempotency key was not cleared properly. For example, [stopping Sidekiq kills any remaining jobs after 25 seconds](https://gitlab.com/gitlab-org/omnibus-gitlab/-/issues/4918).
[By default, the key expires after 6 hours](https://gitlab.com/gitlab-org/gitlab/-/blob/87c92f06eb92716a26679cd339f3787ae7edbdc3/lib/gitlab/sidekiq_middleware/duplicate_jobs/duplicate_job.rb#L23),
but if you want to clear the idempotency key immediately, follow the following steps (the example provided is for `Geo::VerificationBatchWorker`):
1. Find the worker class and `args` of the job in the Sidekiq logs:
```plaintext
{ ... "class":"Geo::VerificationBatchWorker","args":["container_repository"] ... }
```
1. Start a [Rails console session](../operations/rails_console.md#starting-a-rails-console-session).
1. Run the following snippet:
```ruby
worker_class = Geo::VerificationBatchWorker
args = ["container_repository"]
dj = Gitlab::SidekiqMiddleware::DuplicateJobs::DuplicateJob.new({ 'class' => worker_class.name, 'args' => args }, worker_class.queue)
dj.send(:idempotency_key)
dj.delete!
```
## CPU saturation in Redis caused by Sidekiq BRPOP calls
Sidekiq `BROP` calls can cause CPU usage to increase on Redis.
Increase the [`SIDEKIQ_SEMI_RELIABLE_FETCH_TIMEOUT` environment variable](../environment_variables.md) to improve CPU usage on Redis.
## Error: `OpenSSL::Cipher::CipherError`
If you receive error messages like:
```plaintext
"OpenSSL::Cipher::CipherError","exception.message":"","exception.backtrace":["encryptor (3.0.0) lib/encryptor.rb:98:in `final'","encryptor (3.0.0) lib/encryptor.rb:98:in `crypt'","encryptor (3.0.0) lib/encryptor.rb:49:in `decrypt'"
```
This error means that the processes are unable to decrypt encrypted data that is stored in the GitLab database. This indicates that there is some problem with your `/etc/gitlab/gitlab-secrets.json` file, ensure that you copied the file from your main GitLab node to your Sidekiq nodes.
## Related topics
- [Elasticsearch workers overload Sidekiq](../../integration/advanced_search/elasticsearch_troubleshooting.md#elasticsearch-workers-overload-sidekiq).
|
