1
2
3
4
5
6
7
8
9
10
11
12
13
14
15
16
17
18
19
20
21
22
23
24
25
26
27
28
29
30
31
32
33
34
35
36
37
38
39
40
41
42
43
44
45
46
47
48
49
50
51
52
53
54
55
56
57
58
59
60
61
62
63
64
65
66
67
68
69
70
71
72
73
74
75
76
77
78
79
80
81
82
83
84
85
86
87
88
89
90
91
92
93
94
95
96
97
98
99
100
101
102
103
104
105
106
107
108
109
110
111
112
113
114
115
116
117
118
119
120
121
122
123
124
125
126
127
128
129
130
131
132
133
134
135
136
137
138
139
140
141
142
143
144
145
146
147
148
149
150
151
152
153
154
155
156
157
158
159
160
161
162
163
164
165
166
167
168
169
170
171
172
173
174
175
176
177
178
179
180
181
182
183
184
185
186
187
188
189
190
191
192
193
194
195
196
197
198
199
200
201
202
203
204
205
206
207
208
209
210
211
212
213
214
215
216
217
218
219
220
221
222
223
224
225
226
227
228
229
230
231
232
233
234
235
236
237
238
239
240
241
242
243
244
245
246
247
248
249
250
251
252
253
254
255
256
257
258
259
260
261
262
263
264
265
266
267
268
269
270
271
272
273
274
275
276
277
278
279
280
281
282
283
284
285
286
287
288
289
290
291
292
293
294
295
296
297
298
299
300
301
302
303
304
305
306
307
308
309
310
311
312
313
314
315
316
317
318
319
320
321
322
323
324
325
326
327
328
329
330
331
332
333
334
335
336
337
338
339
340
341
342
343
344
345
346
347
348
349
350
351
352
353
354
355
356
357
358
359
360
361
362
363
364
365
366
367
368
369
370
371
372
373
374
375
376
377
378
379
380
381
382
383
384
385
386
387
388
389
390
391
392
393
394
395
396
397
398
399
400
401
402
403
404
405
406
407
408
409
410
411
412
413
414
415
416
417
418
419
420
421
422
423
424
425
426
427
428
429
430
431
432
433
434
435
436
437
438
439
440
441
442
443
444
445
446
447
448
449
450
451
452
453
454
455
456
457
458
459
460
461
462
463
464
465
466
467
468
469
470
471
472
473
474
475
476
477
478
479
480
481
482
483
484
485
486
487
488
489
490
491
492
493
494
495
496
497
498
499
500
501
502
503
504
505
|
---
stage: none
group: unassigned
info: Any user with at least the Maintainer role can merge updates to this content. For details, see https://docs.gitlab.com/ee/development/development_processes.html#development-guidelines-review.
---
# Profiling
To make it easier to track down performance problems GitLab comes with a set of
profiling tools, some of these are available by default while others need to be
explicitly enabled.
## Profiling a URL
There is a `Gitlab::Profiler.profile` method, and corresponding
`bin/profile-url` script, that enable profiling a GET or POST request to a
specific URL, either as an anonymous user (the default) or as a specific user.
The first argument to the profiler is either a full URL
(including the instance hostname) or an absolute path, including the
leading slash.
By default the report dump will be stored in a temporary file, which can be
interacted with using the [Stackprof API](#reading-a-gitlabprofiler-report).
When using the script, command-line documentation is available by passing no
arguments.
When using the method in an interactive console session, any changes to the
application code within that console session is reflected in the profiler
output.
For example:
```ruby
Gitlab::Profiler.profile('/my-user')
# Returns the location of the temp file where the report dump is stored
class UsersController; def show; sleep 100; end; end
Gitlab::Profiler.profile('/my-user')
# Returns the location of the temp file where the report dump is stored
# where 100 seconds is spent in UsersController#show
```
For routes that require authorization you must provide a user to
`Gitlab::Profiler`. You can do this like so:
```ruby
Gitlab::Profiler.profile('/gitlab-org/gitlab-test', user: User.first)
```
Passing a `logger:` keyword argument to `Gitlab::Profiler.profile` sends
ActiveRecord and ActionController log output to that logger. Further options are
documented with the method source.
```ruby
Gitlab::Profiler.profile('/gitlab-org/gitlab-test', user: User.first, logger: Logger.new($stdout))
```
Pass in a `profiler_options` hash to configure the output file (`out`) of the sampling data. For example:
```ruby
Gitlab::Profiler.profile('/gitlab-org/gitlab-test', user: User.first, profiler_options: { out: 'tmp/profile.dump' })
```
## Reading a `GitLab::Profiler` report
You can get a summary of where time was spent by running Stackprof against the sampling data. For example:
```shell
stackprof tmp/profile.dump
```
Example sampling data:
```plaintext
==================================
Mode: wall(1000)
Samples: 8745 (6.92% miss rate)
GC: 1399 (16.00%)
==================================
TOTAL (pct) SAMPLES (pct) FRAME
1022 (11.7%) 1022 (11.7%) Sprockets::PathUtils#stat
957 (10.9%) 957 (10.9%) (marking)
493 (5.6%) 493 (5.6%) Sprockets::PathUtils#entries
576 (6.6%) 471 (5.4%) Mustermann::AST::Translator#decorator_for
439 (5.0%) 439 (5.0%) (sweeping)
630 (7.2%) 241 (2.8%) Sprockets::Cache::FileStore#get
208 (2.4%) 208 (2.4%) ActiveSupport::FileUpdateChecker#watched
206 (2.4%) 206 (2.4%) Digest::Instance#file
544 (6.2%) 176 (2.0%) Sprockets::Cache::FileStore#safe_open
176 (2.0%) 176 (2.0%) ActiveSupport::FileUpdateChecker#max_mtime
268 (3.1%) 147 (1.7%) ActiveRecord::ConnectionAdapters::PostgreSQLAdapter#exec_no_cache
140 (1.6%) 140 (1.6%) ActiveSupport::BacktraceCleaner#add_gem_filter
116 (1.3%) 116 (1.3%) Bootsnap::CompileCache::ISeq.storage_to_output
160 (1.8%) 113 (1.3%) Gem::Version#<=>
109 (1.2%) 109 (1.2%) block in <main>
108 (1.2%) 108 (1.2%) Gem::Version.new
131 (1.5%) 105 (1.2%) Sprockets::EncodingUtils#unmarshaled_deflated
1166 (13.3%) 82 (0.9%) Mustermann::RegexpBased#initialize
82 (0.9%) 78 (0.9%) FileUtils.touch
72 (0.8%) 72 (0.8%) Sprockets::Manifest.compile_match_filter
71 (0.8%) 70 (0.8%) Grape::Router#compile!
91 (1.0%) 65 (0.7%) ActiveRecord::ConnectionAdapters::PostgreSQL::DatabaseStatements#query
93 (1.1%) 64 (0.7%) ActionDispatch::Journey::Path::Pattern::AnchoredRegexp#accept
59 (0.7%) 59 (0.7%) Mustermann::AST::Translator.dispatch_table
62 (0.7%) 59 (0.7%) Rails::BacktraceCleaner#initialize
2492 (28.5%) 49 (0.6%) Sprockets::PathUtils#stat_directory
242 (2.8%) 49 (0.6%) Gitlab::Instrumentation::RedisBase.add_call_details
47 (0.5%) 47 (0.5%) URI::RFC2396_Parser#escape
46 (0.5%) 46 (0.5%) #<Class:0x00000001090c2e70>#__setobj__
44 (0.5%) 44 (0.5%) Sprockets::Base#normalize_logical_path
```
You can also generate flamegraphs:
```shell
stackprof --d3-flamegraph tmp/profile.dump > flamegraph.html
```
See [the Stackprof documentation](https://github.com/tmm1/stackprof) for more details.
## Speedscope flamegraphs
You can generate a flamegraph for a particular URL by selecting a flamegraph sampling mode button in the performance bar or by adding the `performance_bar=flamegraph` parameter to the request.
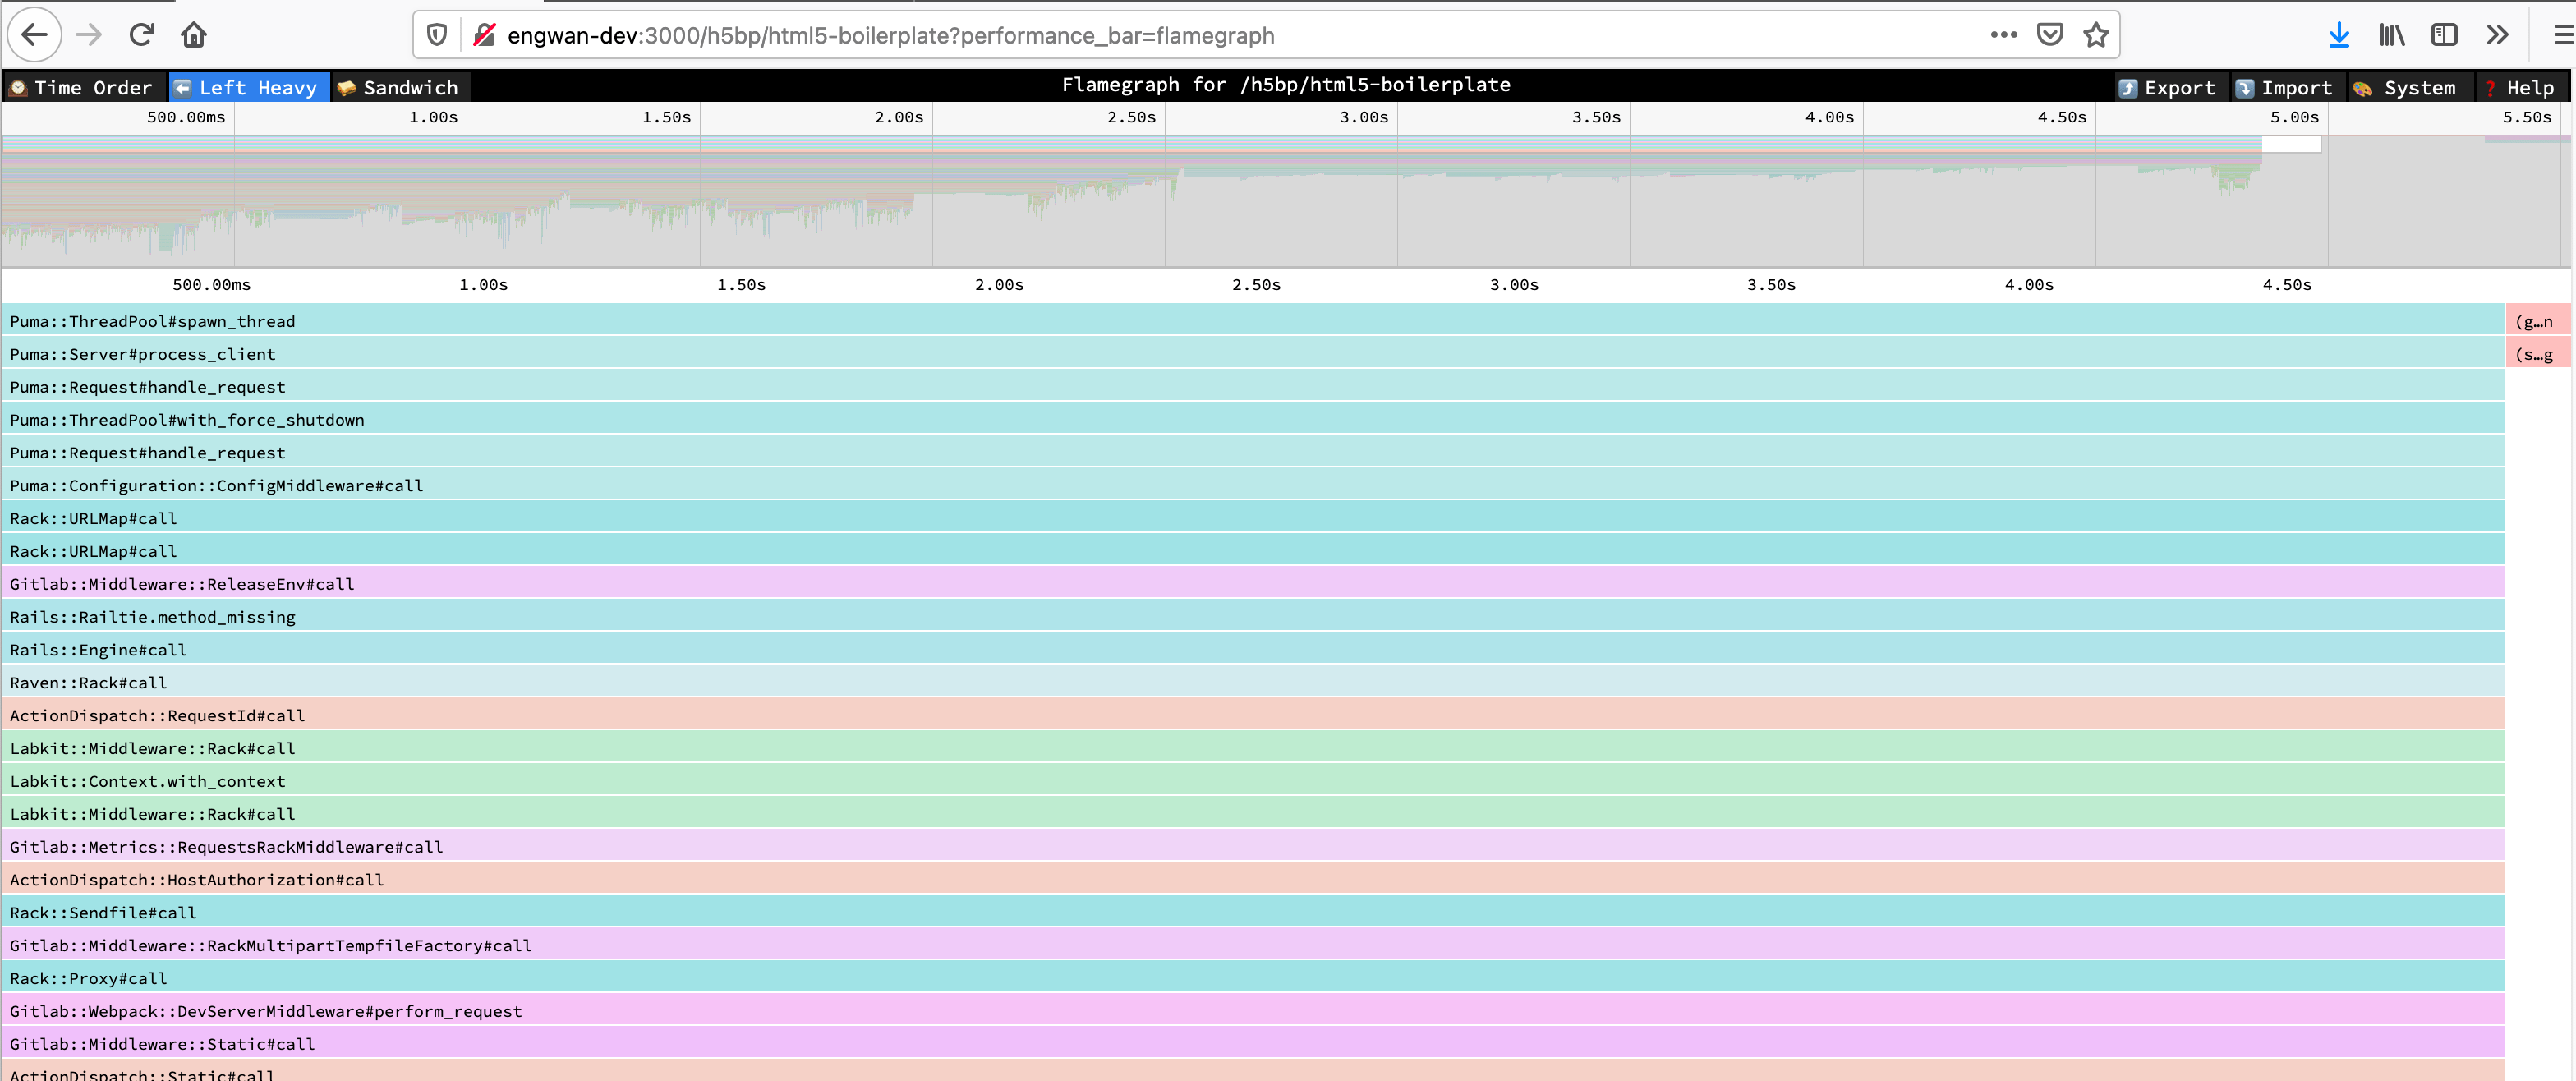
Find more information about the views in the [Speedscope docs](https://github.com/jlfwong/speedscope#views).
Find more information about different sampling modes in the [Stackprof docs](https://github.com/tmm1/stackprof#sampling).
This is enabled for all users that can access the performance bar.
<!-- vale gitlab_base.SubstitutionWarning = NO -->
<!-- Here, "bullet" is a false positive -->
## Bullet
Bullet is a Gem that can be used to track down N+1 query problems. It logs
query problems to the Rails log and the browser console. The **Bullet** section is
displayed on the [performance bar](../administration/monitoring/performance/performance_bar.md).

Bullet is enabled only in development mode by default. However, logging is disabled,
because Bullet logging is noisy. To configure Bullet and its logging:
- To manually enable or disable Bullet on an environment, add these lines to
`config/gitlab.yml`, changing the `enabled` value as needed:
```yaml
bullet:
enabled: false
```
- To enable Bullet logging, set the `ENABLE_BULLET` environment variable to a
non-empty value before starting GitLab:
```shell
ENABLE_BULLET=true bundle exec rails s
```
As a follow-up to finding `N+1` queries with Bullet, consider writing a
[QueryRecoder test](database/query_recorder.md) to prevent a regression.
<!-- vale gitlab_base.SubstitutionWarning = YES -->
## System stats
During or after profiling, you may want to get detailed information about the Ruby virtual machine process,
such as memory consumption, time spent on CPU, or garbage collector statistics. These are easy to produce individually
through various tools, but for convenience, a summary endpoint has been added that exports this data as a JSON payload:
```shell
curl localhost:3000/-/metrics/system | jq
```
Example output:
```json
{
"version": "ruby 2.7.2p137 (2020-10-01 revision a8323b79eb) [x86_64-linux-gnu]",
"gc_stat": {
"count": 118,
"heap_allocated_pages": 11503,
"heap_sorted_length": 11503,
"heap_allocatable_pages": 0,
"heap_available_slots": 4688580,
"heap_live_slots": 3451712,
"heap_free_slots": 1236868,
"heap_final_slots": 0,
"heap_marked_slots": 3451450,
"heap_eden_pages": 11503,
"heap_tomb_pages": 0,
"total_allocated_pages": 11503,
"total_freed_pages": 0,
"total_allocated_objects": 32679478,
"total_freed_objects": 29227766,
"malloc_increase_bytes": 84760,
"malloc_increase_bytes_limit": 32883343,
"minor_gc_count": 88,
"major_gc_count": 30,
"compact_count": 0,
"remembered_wb_unprotected_objects": 114228,
"remembered_wb_unprotected_objects_limit": 228456,
"old_objects": 3185330,
"old_objects_limit": 6370660,
"oldmalloc_increase_bytes": 21838024,
"oldmalloc_increase_bytes_limit": 119181499
},
"memory_rss": 1326501888,
"memory_uss": 1048563712,
"memory_pss": 1139554304,
"time_cputime": 82.885264633,
"time_realtime": 1610459445.5579069,
"time_monotonic": 24001.23145713,
"worker_id": "puma_0"
}
```
NOTE:
This endpoint is only available for Rails web workers. Sidekiq workers cannot be inspected this way.
## Settings that impact performance
### Application settings
1. `development` environment by default works with hot-reloading enabled, this makes Rails to check file changes every request, and create a potential contention lock, as hot reload is single threaded.
1. `development` environment can load code lazily once the request is fired which results in first request to always be slow.
To disable those features for profiling/benchmarking set the `RAILS_PROFILE` environment variable to `true` before starting GitLab. For example when using GDK:
- create a file [`env.runit`](https://gitlab.com/gitlab-org/gitlab-development-kit/-/blob/main/doc/runit.md#modifying-environment-configuration-for-services) in the root GDK directory
- add `export RAILS_PROFILE=true` to your `env.runit` file
- restart GDK with `gdk restart`
*This environment variable is only applicable for the development mode.*
### GC settings
Ruby's garbage collector (GC) can be tuned via a variety of environment variables that will directly impact application performance.
The following table lists these variables along with their default values.
| Environment variable | Default value |
|--|--|
| `RUBY_GC_HEAP_INIT_SLOTS` | `10000` |
| `RUBY_GC_HEAP_FREE_SLOTS` | `4096` |
| `RUBY_GC_HEAP_FREE_SLOTS_MIN_RATIO` | `0.20` |
| `RUBY_GC_HEAP_FREE_SLOTS_GOAL_RATIO` | `0.40` |
| `RUBY_GC_HEAP_FREE_SLOTS_MAX_RATIO` | `0.65` |
| `RUBY_GC_HEAP_GROWTH_FACTOR` | `1.8` |
| `RUBY_GC_HEAP_GROWTH_MAX_SLOTS` | `0 (disable)` |
| `RUBY_GC_HEAP_OLDOBJECT_LIMIT_FACTOR` | `2.0` |
| `RUBY_GC_MALLOC_LIMIT(_MIN)` | `(16 * 1024 * 1024 /* 16MB */)` |
| `RUBY_GC_MALLOC_LIMIT_MAX` | `(32 * 1024 * 1024 /* 32MB */)` |
| `RUBY_GC_MALLOC_LIMIT_GROWTH_FACTOR` | `1.4` |
| `RUBY_GC_OLDMALLOC_LIMIT(_MIN)` | `(16 * 1024 * 1024 /* 16MB */)` |
| `RUBY_GC_OLDMALLOC_LIMIT_MAX` | `(128 * 1024 * 1024 /* 128MB */)` |
| `RUBY_GC_OLDMALLOC_LIMIT_GROWTH_FACTOR` | `1.2` |
([Source](https://github.com/ruby/ruby/blob/45b29754cfba8435bc4980a87cd0d32c648f8a2e/gc.c#L254-L308))
GitLab may decide to change these settings to speed up application performance, lower memory requirements, or both.
You can see how each of these settings affect GC performance, memory use and application start-up time for an idle instance of
GitLab by running the `scripts/perf/gc/collect_gc_stats.rb` script. It will output GC stats and general timing data to standard
out as CSV.
## An example of investigating performance issues
The Pipeline Authoring team has worked on solving [the pipeline creation performance issues](https://gitlab.com/groups/gitlab-org/-/epics/7290)
and used both the existing profiling methods such as [stackprof flamegraphs](#speedscope-flamegraphs) and [`memory_profiler`](performance.md#using-memory-profiler)
and a new method [`ruby-prof`](https://ruby-prof.github.io/).
### Using stackprof flamegraphs
[Performance bar](../administration/monitoring/performance/performance_bar.md) is a great tool to get a stackprof report
and see a flamegraph via a single click;

However, it's not available for other than GET requests.
To get a flamegraph for a POST request, we use the `performance_bar=flamegraph` parameter with the API request.
In our case, we want to see the flamegraph for [the pipeline creation endpoint of a merge request](../api/merge_requests.md#create-merge-request-pipeline).
Normally, we could use the following command to get a stackprof report as a JSON file but our user control
of `Gitlab::PerformanceBar.allowed_for_user?(request.env['warden']&.user)` allows only users authenticated via the web interface.
```shell
# This will not work on production
curl --request POST \
--output flamegraph.json \
--header 'Content-Type: application/json' \
--header 'PRIVATE-TOKEN: :token' \
"https://gitlab.example.com/api/v4/projects/:id/merge_requests/:iid/pipelines?performance_bar=flamegraph"
```
To get around this, we copy the request as `curl` and use it in the terminal.

We'll have a `curl` command like this:
```shell
curl "https://gitlab.com/api/v4/projects/:id/merge_requests/:iid/pipelines" \
-H 'accept: application/json, text/plain, */*' \
-H 'content-type: application/json' \
-H 'cookie: xyz' \
-H 'x-csrf-token: xyz' \
--data-raw '{"async":true}'
```
- Notice the `async` parameter in the request body.
We need to remove it to get the actual performance of the pipeline creation endpoint.
- We need to add the `performance_bar=flamegraph` parameter to the request.
- We need to add the `--output flamegraph.json` parameter to save the JSON response to a file.
- Lastly, we need to accept the JSON response only.
```shell
curl "https://gitlab.com/api/v4/projects/:id/merge_requests/:iid/pipelines?performance_bar=flamegraph" \
-X POST \
-o flamegraph.json \
-H 'accept: application/json' \
-H 'content-type: application/json' \
-H 'cookie: xyz' \
-H 'x-csrf-token: xyz'
```
Then, we use the `flamegraph.json` file on the `https://www.speedscope.app/` website to see the flamegraph.

As an example, when investigating into this speedscope flamegraph, we saw that the `kubernetes_variables` method was
taking a lot of time and created [an issue](https://gitlab.com/gitlab-org/gitlab/-/issues/498648).

### Using `ruby-prof`
Another method to see where to spend most of the time is to use `ruby-prof`.
It's not an included gem in the Gemfile, so we need to add it to the Gemfile and run `bundle install` first.
To investigate the problem, we need to have a replica repository. To do this, we could mirror the repository
from the production instance to the development instance. Then, we can run the `ruby-prof` profiler to see where
the time is spent.
```ruby
# RAILS_PROFILE=true GITALY_DISABLE_REQUEST_LIMITS=true rails console
require 'ruby-prof'
ActiveRecord::Base.logger = nil
project = Project.find_by_full_path('root/gitlab-mirror')
user = project.first_owner
merge_request = project.merge_requests.find_by_iid(1)
profile = RubyProf::Profile.new
profile.exclude_common_methods! # see https://github.com/ruby-prof/ruby-prof/blob/1.7.0/lib/ruby-prof/exclude_common_methods.rb
profile.start
Gitlab::SafeRequestStore.ensure_request_store do
Ci::CreatePipelineService
.new(project, user, ref: merge_request.source_branch)
.execute(:merge_request_event, merge_request: merge_request)
.payload
end; nil
result = profile.stop
callstack_printer = RubyProf::CallStackPrinter.new(result)
File.open('tmp/ruby-prof-callstack-report.html', 'w') do |file|
callstack_printer.print(file)
end
::Ci::DestroyPipelineService.new(project, user).execute(Ci::Pipeline.last)
```
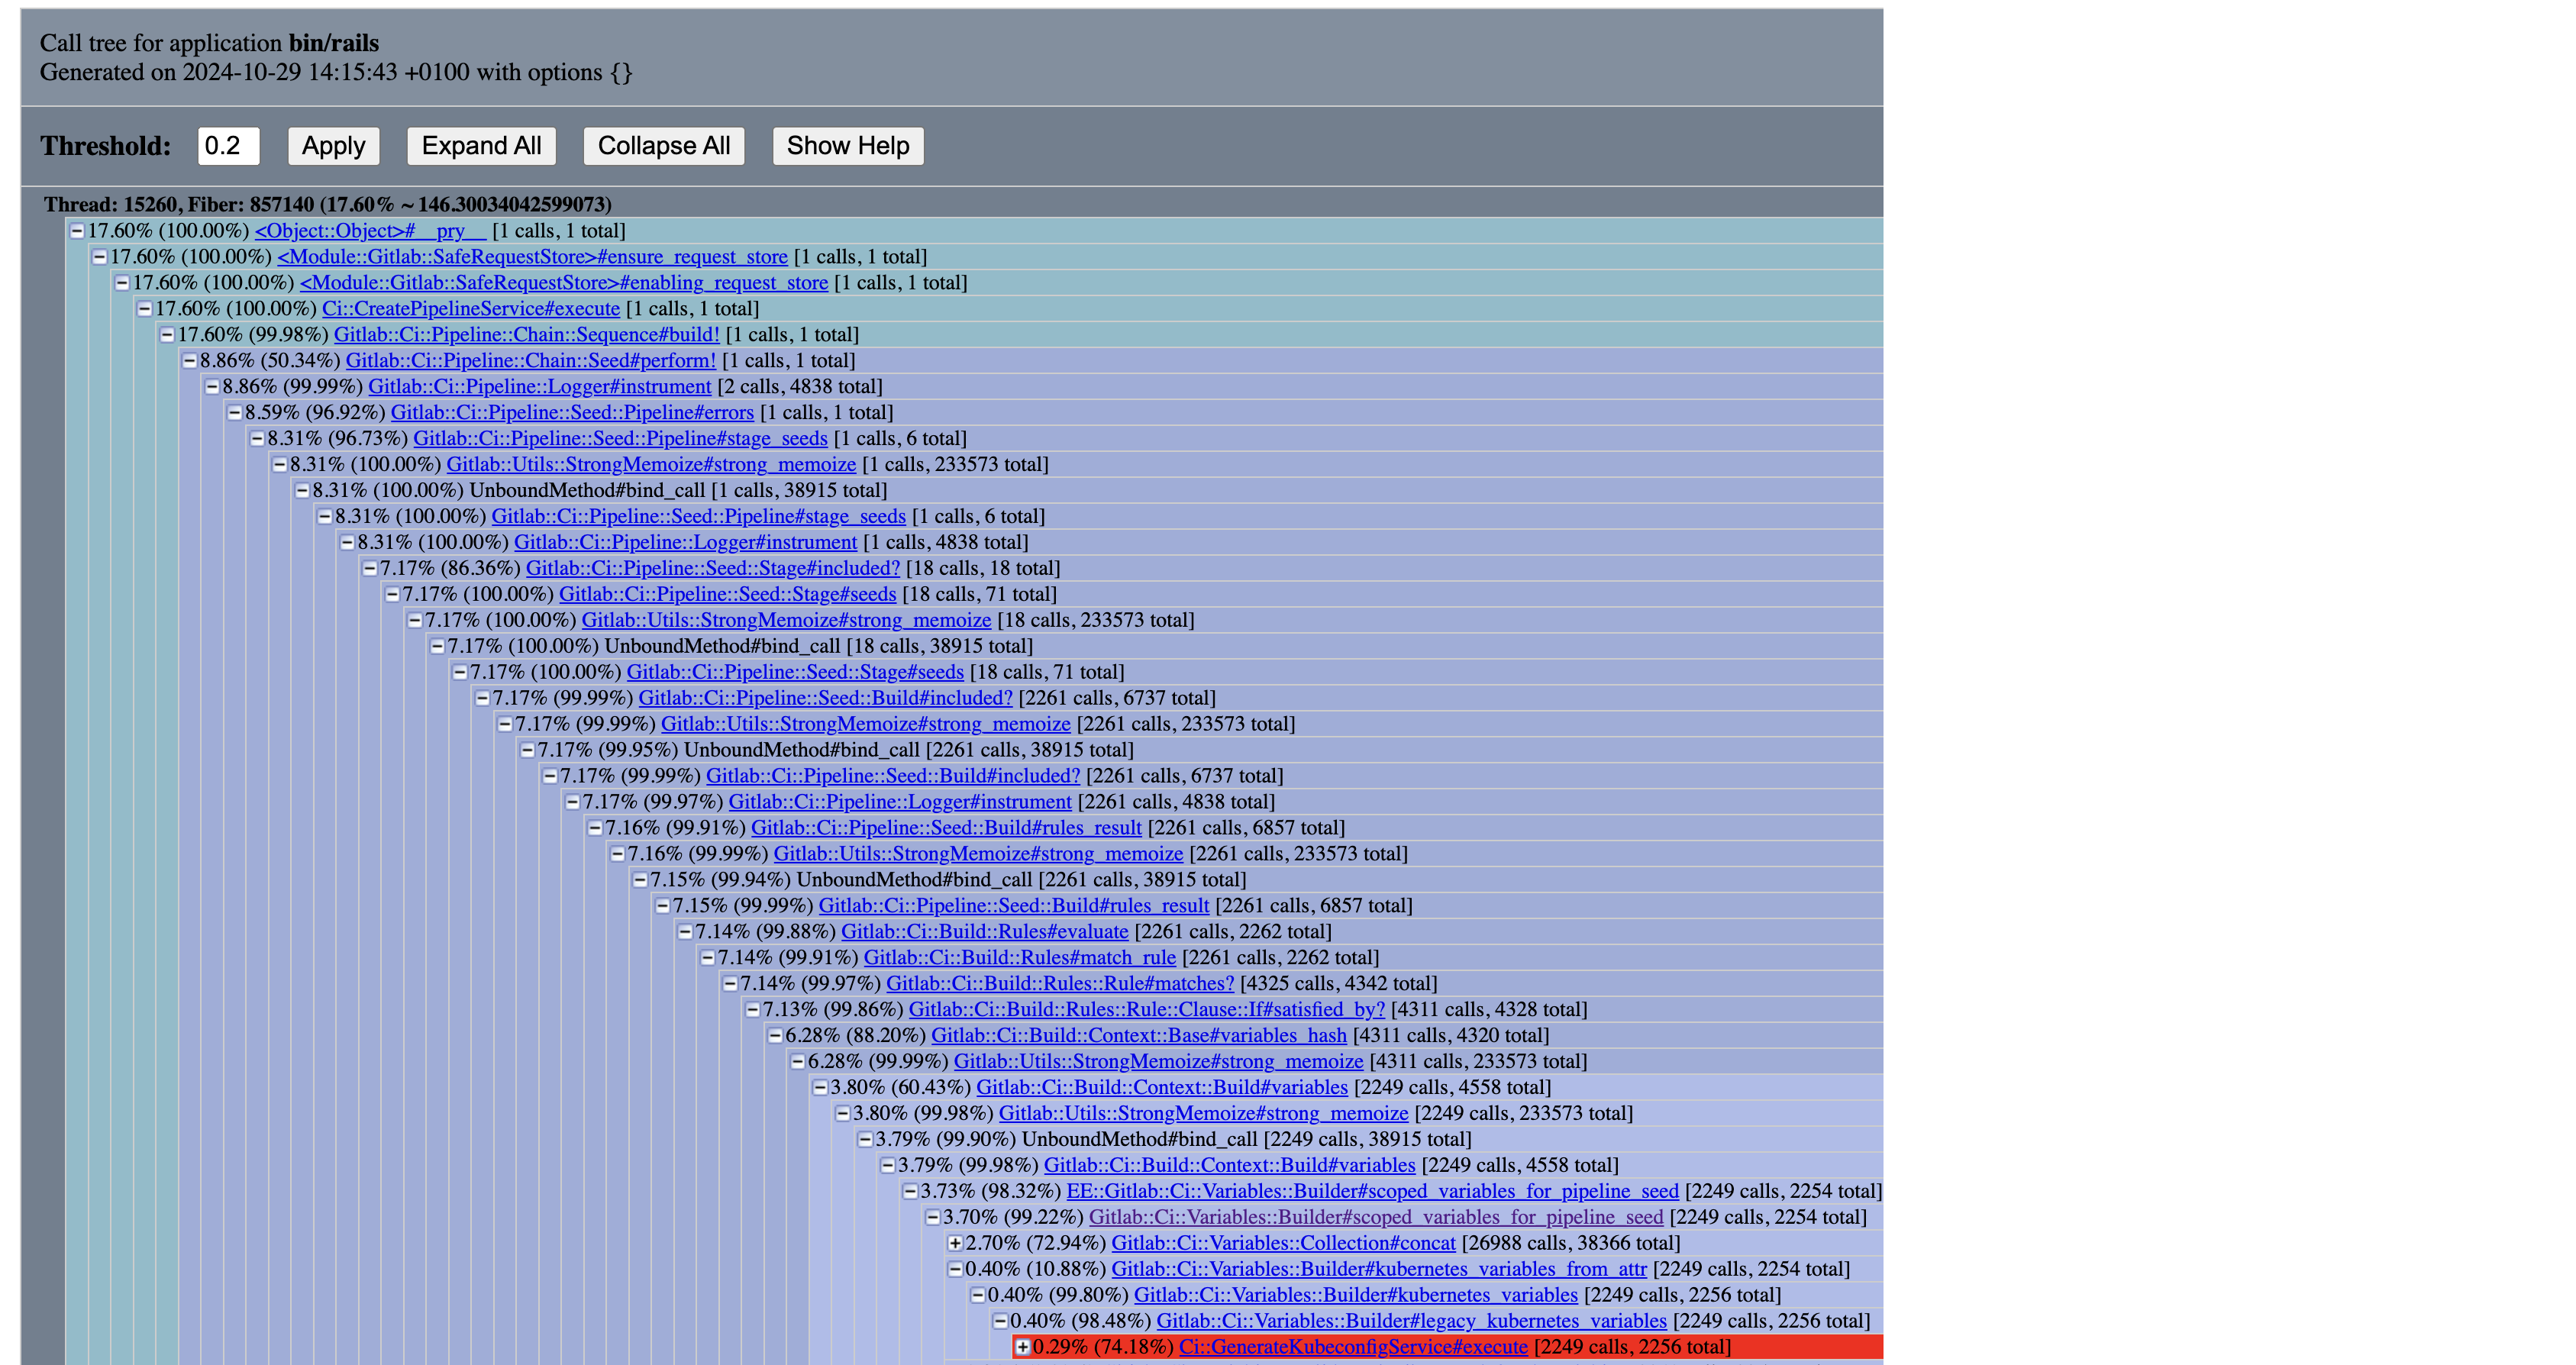
Here, we can see that we call `Ci::GenerateKubeconfigService` ~2k times.
This is a good indicator that we need to investigate this.
### Using `memory_profiler`
[`memory_profiler`](performance.md#using-memory-profiler) is a tool to profile memory usage.
This is also important because high memory usage can lead to performance issues.
As we did with `stackprof`, we could also use `curl` with the `performance_bar` parameter.
```shell
curl "https://gitlab.com/api/v4/projects/:id/merge_requests/:iid/pipelines?performance_bar=memory" \
-X POST \
-o flamegraph.json \
-H 'accept: application/json' \
-H 'content-type: application/json' \
-H 'cookie: xyz' \
-H 'x-csrf-token: xyz'
```
However, this will not work on production because we have 60-second timeouts for the requests.
So, we need to use the development environment to get the memory profile.
More information can be found in the [memory profiler documentation](performance.md#using-memory-profiler).
```ruby
# RAILS_PROFILE=true GITALY_DISABLE_REQUEST_LIMITS=true rails console
require 'memory_profiler'
ActiveRecord::Base.logger = nil
project = Project.find_by_full_path('root/gitlab-mirror')
user = project.first_owner
merge_request = project.merge_requests.find_by_iid(1)
# Warmup
Ci::CreatePipelineService
.new(project, user, ref: merge_request.source_branch)
.execute(:merge_request_event, merge_request: merge_request); nil
report = MemoryProfiler.report do
Gitlab::SafeRequestStore.ensure_request_store do
Ci::CreatePipelineService
.new(project, user, ref: merge_request.source_branch)
.execute(:merge_request_event, merge_request: merge_request); nil
end
end; nil
output = File.open('tmp/memory-profile-report.txt', 'w')
report.pretty_print(output, detailed_report: true, scale_bytes: true, normalize_paths: true)
```
Result;
```plaintext
#
# Note: I redacted some parts related to the gems and the Rails framework.
# also, the output is shortened for readability.
#
Total allocated: 1.30 GB (12974240 objects)
Total retained: 29.67 MB (335085 objects)
allocated memory by gem
-----------------------------------
675.48 MB gitlab/lib
...
allocated memory by file
-----------------------------------
253.68 MB gitlab/lib/gitlab/ci/variables/collection/item.rb
143.58 MB gitlab/lib/gitlab/ci/variables/collection.rb
51.66 MB gitlab/lib/gitlab/config/entry/configurable.rb
20.89 MB gitlab/lib/gitlab/ci/pipeline/expression/lexeme/base.rb
...
allocated memory by location
-----------------------------------
107.12 MB gitlab/lib/gitlab/ci/variables/collection/item.rb:64
70.22 MB gitlab/lib/gitlab/ci/variables/collection.rb:28
57.66 MB gitlab/lib/gitlab/ci/variables/collection.rb:82
45.70 MB gitlab/lib/gitlab/config/entry/configurable.rb:67
42.35 MB gitlab/lib/gitlab/ci/variables/collection/item.rb:17
42.35 MB gitlab/lib/gitlab/ci/variables/collection/item.rb:80
41.32 MB gitlab/lib/gitlab/ci/variables/collection/item.rb:76
20.10 MB gitlab/lib/gitlab/ci/variables/collection/item.rb:72
...
```
In this example, we see where we can optimize the memory usage by looking at the allocated memory by file and location.
And in [a recent work](https://gitlab.com/gitlab-org/gitlab/-/issues/499707),
we [found a way](https://gitlab.com/gitlab-org/gitlab/-/merge_requests/171387) to improve the memory usage and got this result;
```plaintext
#
# Note: I redacted some parts related to the gems and the Rails framework.
# also, the output is shortened for readability.
#
Total allocated: 1.08 GB (11171148 objects)
Total retained: 29.67 MB (335082 objects)
allocated memory by gem
-----------------------------------
495.88 MB gitlab/lib
...
allocated memory by file
-----------------------------------
112.44 MB gitlab/lib/gitlab/ci/variables/collection.rb
105.24 MB gitlab/lib/gitlab/ci/variables/collection/item.rb
51.66 MB gitlab/lib/gitlab/config/entry/configurable.rb
20.89 MB gitlab/lib/gitlab/ci/pipeline/expression/lexeme/base.rb
...
```
Total memory reduction for this example pipeline; ~200 MB.
|
