1
2
3
4
5
6
7
8
9
10
11
12
13
14
15
16
17
18
19
20
21
22
23
24
25
26
27
28
29
30
31
32
33
34
35
36
37
38
39
40
41
42
43
44
45
46
47
48
49
50
51
52
53
54
55
56
57
58
59
60
61
62
63
64
65
66
67
68
69
70
71
72
73
74
75
76
77
78
79
80
81
82
83
84
85
86
87
88
89
90
91
92
93
94
95
96
97
98
99
100
101
102
103
104
105
106
107
108
109
110
111
112
113
114
115
116
117
118
119
120
121
122
123
124
125
126
127
128
129
130
131
132
133
134
135
136
137
138
139
140
141
142
143
144
145
146
147
148
149
150
151
152
153
154
155
156
157
158
159
160
161
162
163
164
165
166
167
168
169
170
171
172
173
174
175
176
177
178
179
180
181
182
183
184
185
186
187
188
189
190
191
192
193
194
195
196
197
198
199
200
201
202
203
204
205
206
207
208
209
210
211
212
213
214
215
216
217
218
219
220
221
222
223
224
225
226
227
228
229
230
231
232
233
234
235
236
237
238
239
240
241
242
243
244
245
246
247
248
249
250
251
252
253
254
255
256
257
258
259
260
261
262
263
264
265
266
267
268
269
270
271
272
273
274
275
276
277
278
279
280
281
282
283
284
285
286
287
288
289
290
291
292
293
294
295
296
297
298
299
300
301
302
303
304
305
306
307
308
309
310
311
312
313
314
315
316
317
318
319
320
321
322
323
324
325
326
327
328
329
330
331
332
333
334
335
336
337
338
339
340
341
342
343
344
345
346
347
348
349
350
351
352
353
354
355
356
357
358
359
360
361
362
363
364
365
366
367
368
369
370
371
372
373
374
375
376
377
378
379
380
381
382
383
384
385
386
387
388
389
390
391
392
393
394
395
396
397
398
399
400
401
402
403
404
405
406
407
408
409
410
411
412
413
414
415
416
417
418
419
420
421
422
423
424
425
426
427
428
429
430
431
432
433
434
435
436
437
438
439
440
441
442
443
444
445
446
447
448
449
450
|
---
stage: Monitor
group: Platform Insights
info: To determine the technical writer assigned to the Stage/Group associated with this page, see https://handbook.gitlab.com/handbook/product/ux/technical-writing/#assignments
---
# Integrations
DETAILS:
**Tier:** Free, Premium, Ultimate
**Offering:** GitLab.com, Self-managed, GitLab Dedicated
GitLab can accept alerts from any source via a webhook receiver. [Alert notifications](alerts.md)
can [trigger paging](paging.md#paging) for on-call rotations or be used to [create incidents](manage_incidents.md#from-an-alert).
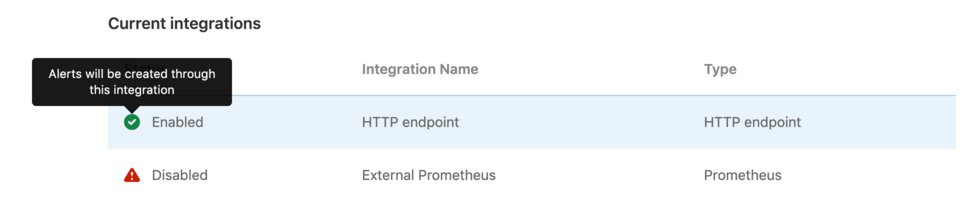
## Integrations list
With at least the Maintainer role, you can view the list of configured
alerts integrations by navigating to **Settings > Monitor**
in your project's sidebar menu, and expanding the **Alerts** section. The list displays
the integration name, type, and status (enabled or disabled):
## Configuration
GitLab can receive alerts via a HTTP endpoint that you configure.
### Single HTTP Endpoint
Enabling the HTTP Endpoint in a GitLab projects activates it to
receive alert payloads in JSON format. You can always
[customize the payload](#customize-the-alert-payload-outside-of-gitlab) to your liking.
1. Sign in to GitLab as a user with the Maintainer role
for a project.
1. Go to **Settings > Monitor** in your project.
1. Expand the **Alerts** section, and in the **Select integration type** dropdown list,
select **HTTP Endpoint**.
1. Toggle the **Active** alert setting. The URL and Authorization Key for the webhook configuration
are available in the **View credentials** tab after you save the integration. You must also input
the URL and Authorization Key in your external service.
### HTTP Endpoints
DETAILS:
**Tier:** Premium, Ultimate
**Offering:** GitLab.com, Self-managed, GitLab Dedicated
In [GitLab Premium](https://about.gitlab.com/pricing/), you can create multiple
unique HTTP endpoints to receive alerts from any external source in JSON format,
and you can [customize the payload](#customize-the-alert-payload-outside-of-gitlab).
1. Sign in to GitLab as a user with the Maintainer role
for a project.
1. Go to **Settings > Monitor** in your project.
1. Expand the **Alerts** section.
1. For each endpoint you want to create:
1. Select **Add new integration**.
1. In the **Select integration type** dropdown list, select **HTTP Endpoint**.
1. Name the integration.
1. Toggle the **Active** alert setting. The **URL** and **Authorization Key** for the webhook
configuration are available in the **View credentials** tab after you save the integration.
You must also input the URL and Authorization Key in your external service.
1. Optional. To map fields from your monitoring tool's alert to GitLab fields, enter a sample
payload and select **Parse payload for custom mapping**. Valid JSON is required. If you update
a sample payload, you must also remap the fields.
1. Optional. If you provided a valid sample payload, select each value in
**Payload alert key** to [map to a **GitLab alert key**](#map-fields-in-custom-alerts).
1. To save your integration, select **Save Integration**. If desired, you can send a test alert
from your integration's **Send test alert** tab after the integration is created.
The new HTTP Endpoint displays in the [integrations list](#integrations-list).
You can edit the integration by selecting the **{settings}** settings icon on the right
side of the integrations list.
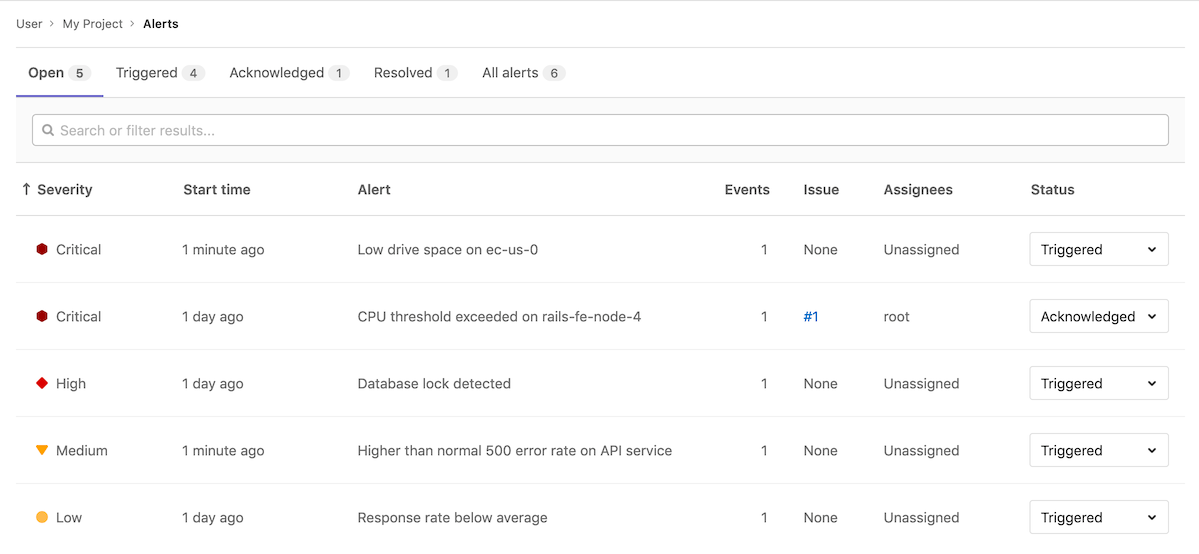
#### Map fields in custom alerts
You can integrate your monitoring tool's alert format with GitLab alerts. To show the
correct information in the [Alert list](alerts.md) and the
[Alert Details page](alerts.md#alert-details-page), map your alert's fields to
GitLab fields when you [create an HTTP endpoint](#http-endpoints):

## Customize the alert payload outside of GitLab
For HTTP Endpoints without [custom mappings](#map-fields-in-custom-alerts), you can customize the payload by sending the following
parameters. All fields are optional. If the incoming alert does not contain a value for the `Title` field, a default value of `New: Alert` is applied.
| Property | Type | Description |
| ------------------------- | --------------- | ----------- |
| `title` | String | The title of the alert.|
| `description` | String | A high-level summary of the problem. |
| `start_time` | DateTime | The time of the alert. If none is provided, a current time is used. |
| `end_time` | DateTime | The resolution time of the alert. If provided, the alert is resolved. |
| `service` | String | The affected service. |
| `monitoring_tool` | String | The name of the associated monitoring tool. |
| `hosts` | String or Array | One or more hosts, as to where this incident occurred. |
| `severity` | String | The severity of the alert. Case-insensitive. Can be one of: `critical`, `high`, `medium`, `low`, `info`, `unknown`. Defaults to `critical` if missing or value is not in this list. |
| `fingerprint` | String or Array | The unique identifier of the alert. This can be used to group occurrences of the same alert. When the `generic_alert_fingerprinting` feature is enabled, the fingerprint is generated automatically based on the payload (excluding the `start_time`, `end_time`, and `hosts` parameters). |
| `gitlab_environment_name` | String | The name of the associated GitLab [environment](../../ci/environments/index.md). Required to [display alerts on a dashboard](../../user/operations_dashboard/index.md#adding-a-project-to-the-dashboard). |
You can also add custom fields to the alert's payload. The values of extra
parameters aren't limited to primitive types (such as strings or numbers), but
can be a nested JSON object. For example:
```json
{ "foo": { "bar": { "baz": 42 } } }
```
NOTE:
Ensure your requests are smaller than the
[payload application limits](../../administration/instance_limits.md#generic-alert-json-payloads).
### Example request body
Example payload:
```json
{
"title": "Incident title",
"description": "Short description of the incident",
"start_time": "2019-09-12T06:00:55Z",
"service": "service affected",
"monitoring_tool": "value",
"hosts": "value",
"severity": "high",
"fingerprint": "d19381d4e8ebca87b55cda6e8eee7385",
"foo": {
"bar": {
"baz": 42
}
}
}
```
### Prometheus endpoint
Prerequisites:
- You must have at least the Maintainer role for the project.
1. On the left sidebar, select **Search or go to** and find your project.
1. Select **Settings > Monitor**.
1. Expand the **Alerts** section, and select **Add new integration**.
1. From the **Select integration type** dropdown list, select **Prometheus**.
1. Turn on the **Active** toggle.
1. Enter the **Prometheus API base URL**.
You should enter a placeholder URL. The features which use this field are [deprecated](https://gitlab.com/gitlab-org/gitlab/-/issues/346541) and [scheduled for removal](https://gitlab.com/gitlab-org/gitlab/-/issues/379252) in GitLab 16.0.
1. Select **Save integration**.
The URL and authorization key for the webhook configuration
are available in the **View credentials** tab.
Enter the URL and authorization key in your external service.
You can also send a test alert from your integration's
[**Send test alert**](#triggering-test-alerts) tab.
#### Add integration credentials to Prometheus Alertmanager
To send Prometheus alert notifications to GitLab, copy the URL and authorization key from
your [Prometheus integration](#prometheus-endpoint) into the
[`webhook_configs`](https://prometheus.io/docs/alerting/latest/configuration/#webhook_config)
section of the Prometheus Alertmanager configuration:
```yaml
receivers:
- name: gitlab
webhook_configs:
- http_config:
authorization:
type: Bearer
credentials: 1234567890abdcdefg
send_resolved: true
url: http://IP_ADDRESS:PORT/root/manual_prometheus/prometheus/alerts/notify.json
# Rest of configuration omitted
# ...
```
#### Expected request attributes
Alerts are expected to be formatted for a Prometheus [webhook receiver](https://prometheus.io/docs/alerting/latest/configuration/#webhook_config).
Top-level required attributes:
- `alerts`
- `commonAnnotations`
- `commonLabels`
- `externalURL`
- `groupKey`
- `groupLabels`
- `receiver`
- `status`
- `version`
From `alerts` in the Prometheus payload, a GitLab alert is created for each item in the array.
You can alter the nested parameters listed below to configure the GitLab alert.
| Attribute | Type | Required | Description |
| -------------------------------------------------------------------------- | -------- | -------- | ------------------------------------ |
| One of `annotations/title`, `annotations/summary`, or `labels/alertname` | String | Yes | The title of the alert. |
| `startsAt` | DateTime | Yes | The start time of the alert. |
| `annotations/description` | String | No | A high-level summary of the problem. |
| `annotations/gitlab_incident_markdown` | String | No | [GitLab Flavored Markdown](../../user/markdown.md) to be appended to any incident created from the alert. |
| `annotations/runbook` | String | No | Link to documentation or instructions for how to manage this alert. |
| `endsAt` | DateTime | No | The resolution time of the alert. |
| `g0.expr` query parameter in `generatorUrl` | String | No | Query of associated metric. |
| `labels/gitlab_environment_name` | String | No | The name of the associated GitLab [environment](../../ci/environments/index.md). Required to [display alerts on a dashboard](../../user/operations_dashboard/index.md#adding-a-project-to-the-dashboard). |
| `labels/severity` | String | No | Severity of the alert. Should be one of the [Prometheus severity options](#prometheus-severity-options). Defaults to `critical` if missing or value is not in this list. |
| `status` | String | No | Status of the alert in Prometheus. If value is 'resolved', the alert is resolved. |
| One of `annotations/gitlab_y_label`, `annotations/title`, `annotations/summary`, or `labels/alertname` | String | No | The Y-Axis label to be used when embedding the metrics for this alert in [GitLab Flavored Markdown](../../user/markdown.md). |
Additional attributes included under `annotations` are available on
the [alert details page](alerts.md#alert-details-page). Any other attributes are ignored.
Attributes aren't limited to primitive types (such as strings or numbers), but
can be a nested JSON object. For example:
```json
{
"target": {
"user": {
"id": 42
}
}
}
```
NOTE:
Ensure your requests are smaller than the
[payload application limits](../../administration/instance_limits.md#generic-alert-json-payloads).
#### Prometheus severity options
Alerts from Prometheus can provide any of the case-insensitive follow values for [alert severity](../incident_management/alerts.md#alert-severity):
- **Critical**: `critical`, `s1`, `p1`, `emergency`, `fatal`
- **High**: `high`, `s2`, `p2`, `major`, `page`
- **Medium**: `medium`, `s3`, `p3`, `error`, `alert`
- **Low**: `low`, `s4`, `p4`, `warn`, `warning`
- **Info**: `info`, `s5`, `p5`, `debug`, `information`, `notice`
The severity defaults to `critical` if the value is missing or not in this list.
#### Example Prometheus alert
Example alerting rule:
```yaml
groups:
- name: example
rules:
- alert: ServiceDown
expr: up == 0
for: 5m
labels:
severity: high
annotations:
title: "Example title"
runbook: "http://example.com/my-alert-runbook"
description: "Service has been down for more than 5 minutes."
gitlab_y_label: "y-axis label"
foo:
bar:
baz: 42
```
Example request payload:
```json
{
"version" : "4",
"groupKey": null,
"status": "firing",
"receiver": "",
"groupLabels": {},
"commonLabels": {},
"commonAnnotations": {},
"externalURL": "",
"alerts": [{
"startsAt": "2022-010-30T11:22:40Z",
"generatorURL": "http://host?g0.expr=up",
"endsAt": null,
"status": "firing",
"labels": {
"gitlab_environment_name": "production",
"severity": "high"
},
"annotations": {
"title": "Example title",
"runbook": "http://example.com/my-alert-runbook",
"description": "Service has been down for more than 5 minutes.",
"gitlab_y_label": "y-axis label",
"foo": {
"bar": {
"baz": 42
}
}
}
}]
}
```
## Authorization
The following authorization methods are accepted:
- Bearer authorization header
- Basic authentication
The `<authorization_key>` and `<url>` values can be found when configuring an alert integration.
### Bearer authorization header
The authorization key can be used as the Bearer token:
```shell
curl --request POST \
--data '{"title": "Incident title"}' \
--header "Authorization: Bearer <authorization_key>" \
--header "Content-Type: application/json" \
<url>
```
### Basic authentication
The authorization key can be used as the `password`. The `username` is left blank:
- username: `<blank>`
- password: `<authorization_key>`
```shell
curl --request POST \
--data '{"title": "Incident title"}' \
--header "Authorization: Basic <base_64_encoded_credentials>" \
--header "Content-Type: application/json" \
<url>
```
Basic authentication can also be used with credentials directly in the URL:
```shell
curl --request POST \
--data '{"title": "Incident title"}' \
--header "Content-Type: application/json" \
<username:password@url>
```
WARNING:
Using your authorization key in the URL is insecure, as it's visible in server logs. We recommend
using one of the above header options if your tooling supports it.
## Response body
The JSON response body contains a list of any alerts created within the request:
```json
[
{
"iid": 1,
"title": "Incident title"
},
{
"iid": 2,
"title": "Second Incident title"
}
]
```
Successful responses return a `200` response code.
## Triggering test alerts
After a [project maintainer or owner](../../user/permissions.md)
configures an integration, you can trigger a test
alert to confirm your integration works properly.
1. Sign in as a user with at least the Developer role.
1. Go to **Settings > Monitor** in your project.
1. Select **Alerts** to expand the section.
1. Select the **{settings}** settings icon on the right side of the integration in [the list](#integrations-list).
1. Select the **Send test alert** tab to open it.
1. Enter a test payload in the payload field (valid JSON is required).
1. Select **Send**.
GitLab displays an error or success message, depending on the outcome of your test.
## Automatic grouping of identical alerts
DETAILS:
**Tier:** Premium, Ultimate
**Offering:** GitLab.com, Self-managed, GitLab Dedicated
GitLab groups alerts based on their payload. When an incoming alert contains the same payload as another alert
(excluding the `start_time` and `hosts` attributes), GitLab groups these alerts
together and displays a counter on the [Alert Management List](incidents.md)
and details pages.
If the existing alert is already `resolved`, GitLab creates a new alert instead.
## Recovery alerts
The alert in GitLab is automatically resolved when an HTTP Endpoint
receives a payload with the end time of the alert set. For HTTP Endpoints
without [custom mappings](#map-fields-in-custom-alerts), the expected
field is `end_time`. With custom mappings, you can select the expected field.
GitLab determines which alert to resolve based on the `fingerprint` value that can be provided as
part of the payload.
For more information on alert properties and mappings, see
[Customize the alert payload outside of GitLab](#customize-the-alert-payload-outside-of-gitlab).
You can also configure the associated [incident to be closed automatically](../incident_management/manage_incidents.md#automatically-close-incidents-via-recovery-alerts) when the alert resolves.
## Link to your Opsgenie Alerts
DETAILS:
**Tier:** Premium, Ultimate
**Offering:** GitLab.com, Self-managed, GitLab Dedicated
> - [Introduced](https://gitlab.com/groups/gitlab-org/-/epics/3066) in GitLab 13.2.
WARNING:
We are building deeper integration with Opsgenie and other alerting tools through
[HTTP endpoint integrations](#single-http-endpoint) so you can see alerts in
the GitLab interface.
You can monitor alerts using a GitLab integration with [Opsgenie](https://www.atlassian.com/software/opsgenie).
If you enable the Opsgenie integration, you can't have other GitLab alert
services
active at the same time.
To enable Opsgenie integration:
1. Sign in as a user with the Maintainer or Owner role.
1. Go to **Monitor > Alerts**.
1. In the **Integrations** select box, select **Opsgenie**.
1. Select the **Active** toggle.
1. In the **API URL** field, enter the base URL for your Opsgenie integration,
such as `https://app.opsgenie.com/alert/list`.
1. Select **Save changes**.
After you enable the integration, go to the **Alerts** page at
**Monitor > Alerts**, and then select **View alerts in Opsgenie**.
|
