1
2
3
4
5
6
7
8
9
10
11
12
13
14
15
16
17
18
19
20
21
22
23
24
25
26
27
28
29
30
31
32
33
34
35
36
37
38
39
40
41
42
43
44
45
46
47
48
49
50
51
52
53
54
55
56
57
58
59
60
61
62
63
64
65
66
67
68
69
70
71
72
73
74
75
76
77
78
79
80
81
82
83
84
85
86
87
88
89
90
91
92
93
94
95
96
97
98
99
100
101
102
103
104
105
106
107
108
109
110
111
112
113
114
115
116
117
118
119
|
---
stage: Monitor
group: Platform Insights
info: To determine the technical writer assigned to the Stage/Group associated with this page, see https://handbook.gitlab.com/handbook/product/ux/technical-writing/#assignments
---
# Tutorial: Use GitLab Observability with a Java Spring application
For more information, see the history of the [**Distributed tracing** feature](../../operations/tracing.md).
<!-- Update this note when observability_features flag is removed -->
In this tutorial, you'll learn how to create, configure, instrument, and monitor a Java Spring application using GitLab Observability features.
## Before you begin
To follow along this tutorial, you must have:
- A GitLab Ultimate subscription for GitLab.com or GitLab self-managed
- A local installation of Ruby on Rails
- Basic knowledge of Git, Java Spring, and the core concepts of [OpenTelemetry](https://opentelemetry.io/)
## Create a GitLab project
First, create a GitLab project and a corresponding access token.
1. On the left sidebar, at the top, select **Create new** (**{plus}**) and **New project/repository**.
1. Select **Create from template**.
1. Select **Spring** and then **Use template**.
1. Enter the project details.
- In the **Project name** field, enter a name such as `test-spring-o11y`
1. Select **Create project**.
1. In the `test-sprint-o11y` project, on the left sidebar, select **Settings > Access tokens**.
1. Create an access token with the `api` scope and Developer role. Store the token value somewhere safe.
You'll need it later.
## Run the application
Next, we'll run the application to ensure that it works.
1. After cloning the project from GitLab, open it in IntelliJ (or your preferred IDE).
1. Open `src/main/java/com.example.demo/DemoApplication` and run the application:

1. After initialization, the application should be available at `http://localhost:8000`. Test it out, then in the IDE select the **Stop** button.
## Add the OpenTelemetry dependencies
Use auto-instrumentation to instrument the application:
1. In the `pom.xml` file, add the required dependencies:
```xml
<dependency>
<groupId>io.opentelemetry</groupId>
<artifactId>opentelemetry-api</artifactId>
</dependency>
<dependency>
<groupId>io.opentelemetry</groupId>
<artifactId>opentelemetry-sdk-extension-autoconfigure</artifactId>
</dependency>
<dependency>
<groupId>io.opentelemetry</groupId>
<artifactId>opentelemetry-sdk-extension-autoconfigure-spi</artifactId>
</dependency>
```
```xml
<dependencyManagement>
<dependencies>
<dependency>
<groupId>io.opentelemetry</groupId>
<artifactId>opentelemetry-bom</artifactId>
<version>1.40.0</version>
<type>pom</type>
<scope>import</scope>
</dependency>
</dependencies>
</dependencyManagement>
```
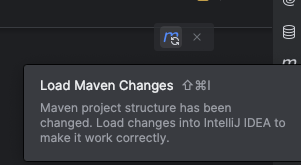
1. Update dependencies by selecting **Update Maven Changes**:
1. Download the OpenTelemetry java agent file from the OpenTelemetry repository.
```shell
curl --location --http1.0 "https://github.com/open-telemetry/opentelemetry-java-instrumentation/releases/latest/download/opentelemetry-javaagent.jar"
```
## Define environment variables
The OpenTelemetry autoconfigure libraries read their configuration from environment variables.
1. From the top-right menu, select **Edit Configurations...**:

1. In the configuration menu, select the icon in the **Environment Variables** field.

1. Add the following set of environment variables, replacing `{{PATH_TO_JAVA_AGENT}}`, `{{PROJECT_ID}}`, `{{PROJECT_ACCESS_TOKEN}}` and `{{SERVICE_NAME}}` with the correct values. If using a self-managed GitLab instance, replace `gitlab.com` with your self-managed instance hostname.
- `JAVA_TOOL_OPTIONS=-javaagent:{{PATH_TO_JAVA_AGENT}}/opentelemetry-javaagent.jar`
- `OTEL_EXPORTER_OTLP_ENDPOINT=https://gitlab.com/api/v4/projects/{{PROJECT_ID}}/observability`
- `OTEL_EXPORTER_OTLP_HEADERS=PRIVATE-TOKEN\={{PROJECT_ACCESS_TOKEN}}`
- `OTEL_EXPORTER=otlphttp`
- `OTEL_METRIC_EXPORT_INTERVAL=15000`
- `OTEL_SERVICE_NAME=example-java-application`
1. Restart the application and reload the page at `http://localhost:8000` a few times.
## View the information in GitLab
To view the exported information from your test project:
1. On the left sidebar, select **Search or go to** and find your project.
1. Select **Monitor**, then either **Logs**, **Metrics**, or **Traces**.
|
