1
2
3
4
5
6
7
8
9
10
11
12
13
14
15
16
17
18
19
20
21
22
23
24
25
26
27
28
29
30
31
32
33
34
35
36
37
38
39
40
41
42
43
44
45
46
47
48
49
50
51
52
53
54
55
56
57
58
59
60
61
62
63
64
65
66
67
68
69
70
|
# guidata: Automatic GUI generation for easy dataset editing and display with Python
[](https://pypi.org/project/guidata/)
[](https://github.com/PlotPyStack/guidata/)
[](https://pypi.python.org/pypi/guidata/)
[](https://www.anaconda.com/download/)
ℹ️ Created in 2009 by [Pierre Raybaut](https://github.com/PierreRaybaut) and maintained by the [PlotPyStack](https://github.com/PlotPyStack) organization.
## Overview
The `guidata` package is a Python library generating Qt graphical user interfaces.
It is part of the [PlotPyStack](https://github.com/PlotPyStack) project, aiming at
providing a unified framework for creating scientific GUIs with Python and Qt.
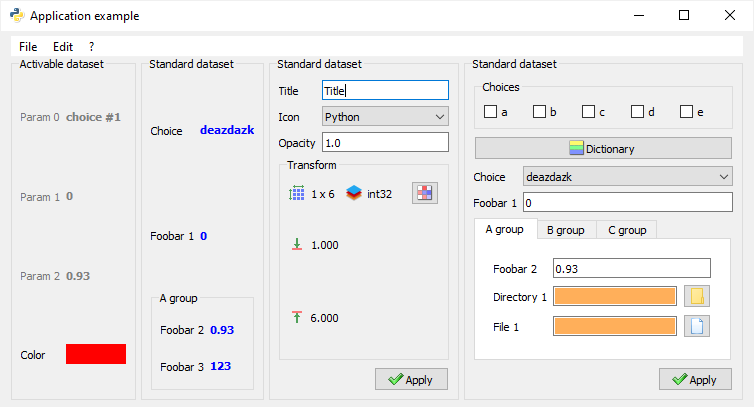
Simple example of `guidata` datasets embedded in an application window:
See [documentation](https://guidata.readthedocs.io/en/latest/) for more details on
the library.
Copyrights and licensing:
* Copyright © 2023 [CEA](https://www.cea.fr), [Codra](https://codra.net/), [Pierre Raybaut](https://github.com/PierreRaybaut).
* Licensed under the terms of the BSD 3-Clause (see [LICENSE](https://github.com/PlotPyStack/guidata/blob/master/LICENSE)).
## Features
Based on the Qt library, `guidata` is a Python library generating graphical user
interfaces for easy dataset editing and display. It also provides helpers and
application development tools for Qt (PyQt5, PySide2, PyQt6, PySide6).
Generate GUIs to edit and display all kind of objects regrouped in datasets:
* Integers, floats, strings
* Lists (single/multiple choices)
* Dictionaries
* `ndarrays` (NumPy's N-dimensional arrays)
* Etc.
Save and load datasets to/from HDF5, JSON or INI files.
Application development tools:
* Data model (internal data structure, serialization, etc.)
* Configuration management
* Internationalization (`gettext`)
* Deployment tools
* HDF5, JSON and INI I/O helpers
* Qt helpers
* Ready-to-use Qt widgets: Python console, source code editor, array editor, etc.
## Dependencies and installation
### Supported Qt versions and bindings
The whole PlotPyStack set of libraries relies on the [Qt](https://doc.qt.io/) GUI toolkit, thanks to [QtPy](https://pypi.org/project/QtPy/), an abstraction layer which allows to use the same API to interact with different Python-to-Qt bindings (PyQt5, PyQt6, PySide2, PySide6).
Compatibility table:
| guidata version | PyQt5 | PyQt6 | PySide2 | PySide6 |
|----------------|-------|-------|---------|---------|
| 3.0-3.5 | ✅ | ⚠️ | ❌ | ⚠️ |
| Latest | ✅ | ✅ | ❌ | ✅ |
### Other dependencies and installation
See [Installation](https://guidata.readthedocs.io/en/latest/installation.html)
section in the documentation for more details.
|
