1
2
3
4
5
6
7
8
9
10
11
12
13
14
15
16
17
18
19
20
21
22
23
24
25
26
27
28
29
30
31
32
33
34
35
36
37
38
39
40
41
42
43
44
45
46
47
48
49
50
51
52
53
54
55
56
57
58
59
60
61
62
63
64
65
66
67
68
69
70
71
72
73
74
75
76
77
78
79
80
81
82
83
84
85
86
87
88
89
90
91
92
93
94
95
96
97
98
99
100
101
102
103
104
105
106
107
108
109
|
Image Gradients {#tutorial_py_gradients}
===============
Goal
----
In this chapter, we will learn to:
- Find Image gradients, edges etc
- We will see following functions : **cv.Sobel()**, **cv.Scharr()**, **cv.Laplacian()** etc
Theory
------
OpenCV provides three types of gradient filters or High-pass filters, Sobel, Scharr and Laplacian.
We will see each one of them.
### 1. Sobel and Scharr Derivatives
Sobel operators is a joint Gausssian smoothing plus differentiation operation, so it is more
resistant to noise. You can specify the direction of derivatives to be taken, vertical or horizontal
(by the arguments, yorder and xorder respectively). You can also specify the size of kernel by the
argument ksize. If ksize = -1, a 3x3 Scharr filter is used which gives better results than 3x3 Sobel
filter. Please see the docs for kernels used.
### 2. Laplacian Derivatives
It calculates the Laplacian of the image given by the relation,
\f$\Delta src = \frac{\partial ^2{src}}{\partial x^2} + \frac{\partial ^2{src}}{\partial y^2}\f$ where
each derivative is found using Sobel derivatives. If ksize = 1, then following kernel is used for
filtering:
\f[kernel = \begin{bmatrix} 0 & 1 & 0 \\ 1 & -4 & 1 \\ 0 & 1 & 0 \end{bmatrix}\f]
Code
----
Below code shows all operators in a single diagram. All kernels are of 5x5 size. Depth of output
image is passed -1 to get the result in np.uint8 type.
@code{.py}
import numpy as np
import cv2 as cv
from matplotlib import pyplot as plt
img = cv.imread('dave.jpg',0)
laplacian = cv.Laplacian(img,cv.CV_64F)
sobelx = cv.Sobel(img,cv.CV_64F,1,0,ksize=5)
sobely = cv.Sobel(img,cv.CV_64F,0,1,ksize=5)
plt.subplot(2,2,1),plt.imshow(img,cmap = 'gray')
plt.title('Original'), plt.xticks([]), plt.yticks([])
plt.subplot(2,2,2),plt.imshow(laplacian,cmap = 'gray')
plt.title('Laplacian'), plt.xticks([]), plt.yticks([])
plt.subplot(2,2,3),plt.imshow(sobelx,cmap = 'gray')
plt.title('Sobel X'), plt.xticks([]), plt.yticks([])
plt.subplot(2,2,4),plt.imshow(sobely,cmap = 'gray')
plt.title('Sobel Y'), plt.xticks([]), plt.yticks([])
plt.show()
@endcode
Result:

One Important Matter!
---------------------
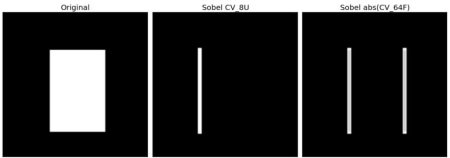
In our last example, output datatype is cv.CV_8U or np.uint8. But there is a slight problem with
that. Black-to-White transition is taken as Positive slope (it has a positive value) while
White-to-Black transition is taken as a Negative slope (It has negative value). So when you convert
data to np.uint8, all negative slopes are made zero. In simple words, you miss that edge.
If you want to detect both edges, better option is to keep the output datatype to some higher forms,
like cv.CV_16S, cv.CV_64F etc, take its absolute value and then convert back to cv.CV_8U.
Below code demonstrates this procedure for a horizontal Sobel filter and difference in results.
@code{.py}
import numpy as np
import cv2 as cv
from matplotlib import pyplot as plt
img = cv.imread('box.png',0)
# Output dtype = cv.CV_8U
sobelx8u = cv.Sobel(img,cv.CV_8U,1,0,ksize=5)
# Output dtype = cv.CV_64F. Then take its absolute and convert to cv.CV_8U
sobelx64f = cv.Sobel(img,cv.CV_64F,1,0,ksize=5)
abs_sobel64f = np.absolute(sobelx64f)
sobel_8u = np.uint8(abs_sobel64f)
plt.subplot(1,3,1),plt.imshow(img,cmap = 'gray')
plt.title('Original'), plt.xticks([]), plt.yticks([])
plt.subplot(1,3,2),plt.imshow(sobelx8u,cmap = 'gray')
plt.title('Sobel CV_8U'), plt.xticks([]), plt.yticks([])
plt.subplot(1,3,3),plt.imshow(sobel_8u,cmap = 'gray')
plt.title('Sobel abs(CV_64F)'), plt.xticks([]), plt.yticks([])
plt.show()
@endcode
Check the result below:
Additional Resources
--------------------
Exercises
---------
|
