1
2
3
4
5
6
7
8
9
10
11
12
13
14
15
16
17
18
19
20
21
22
23
24
25
26
27
28
29
30
31
32
33
34
35
36
|
--------------------------------------------------------------------------------
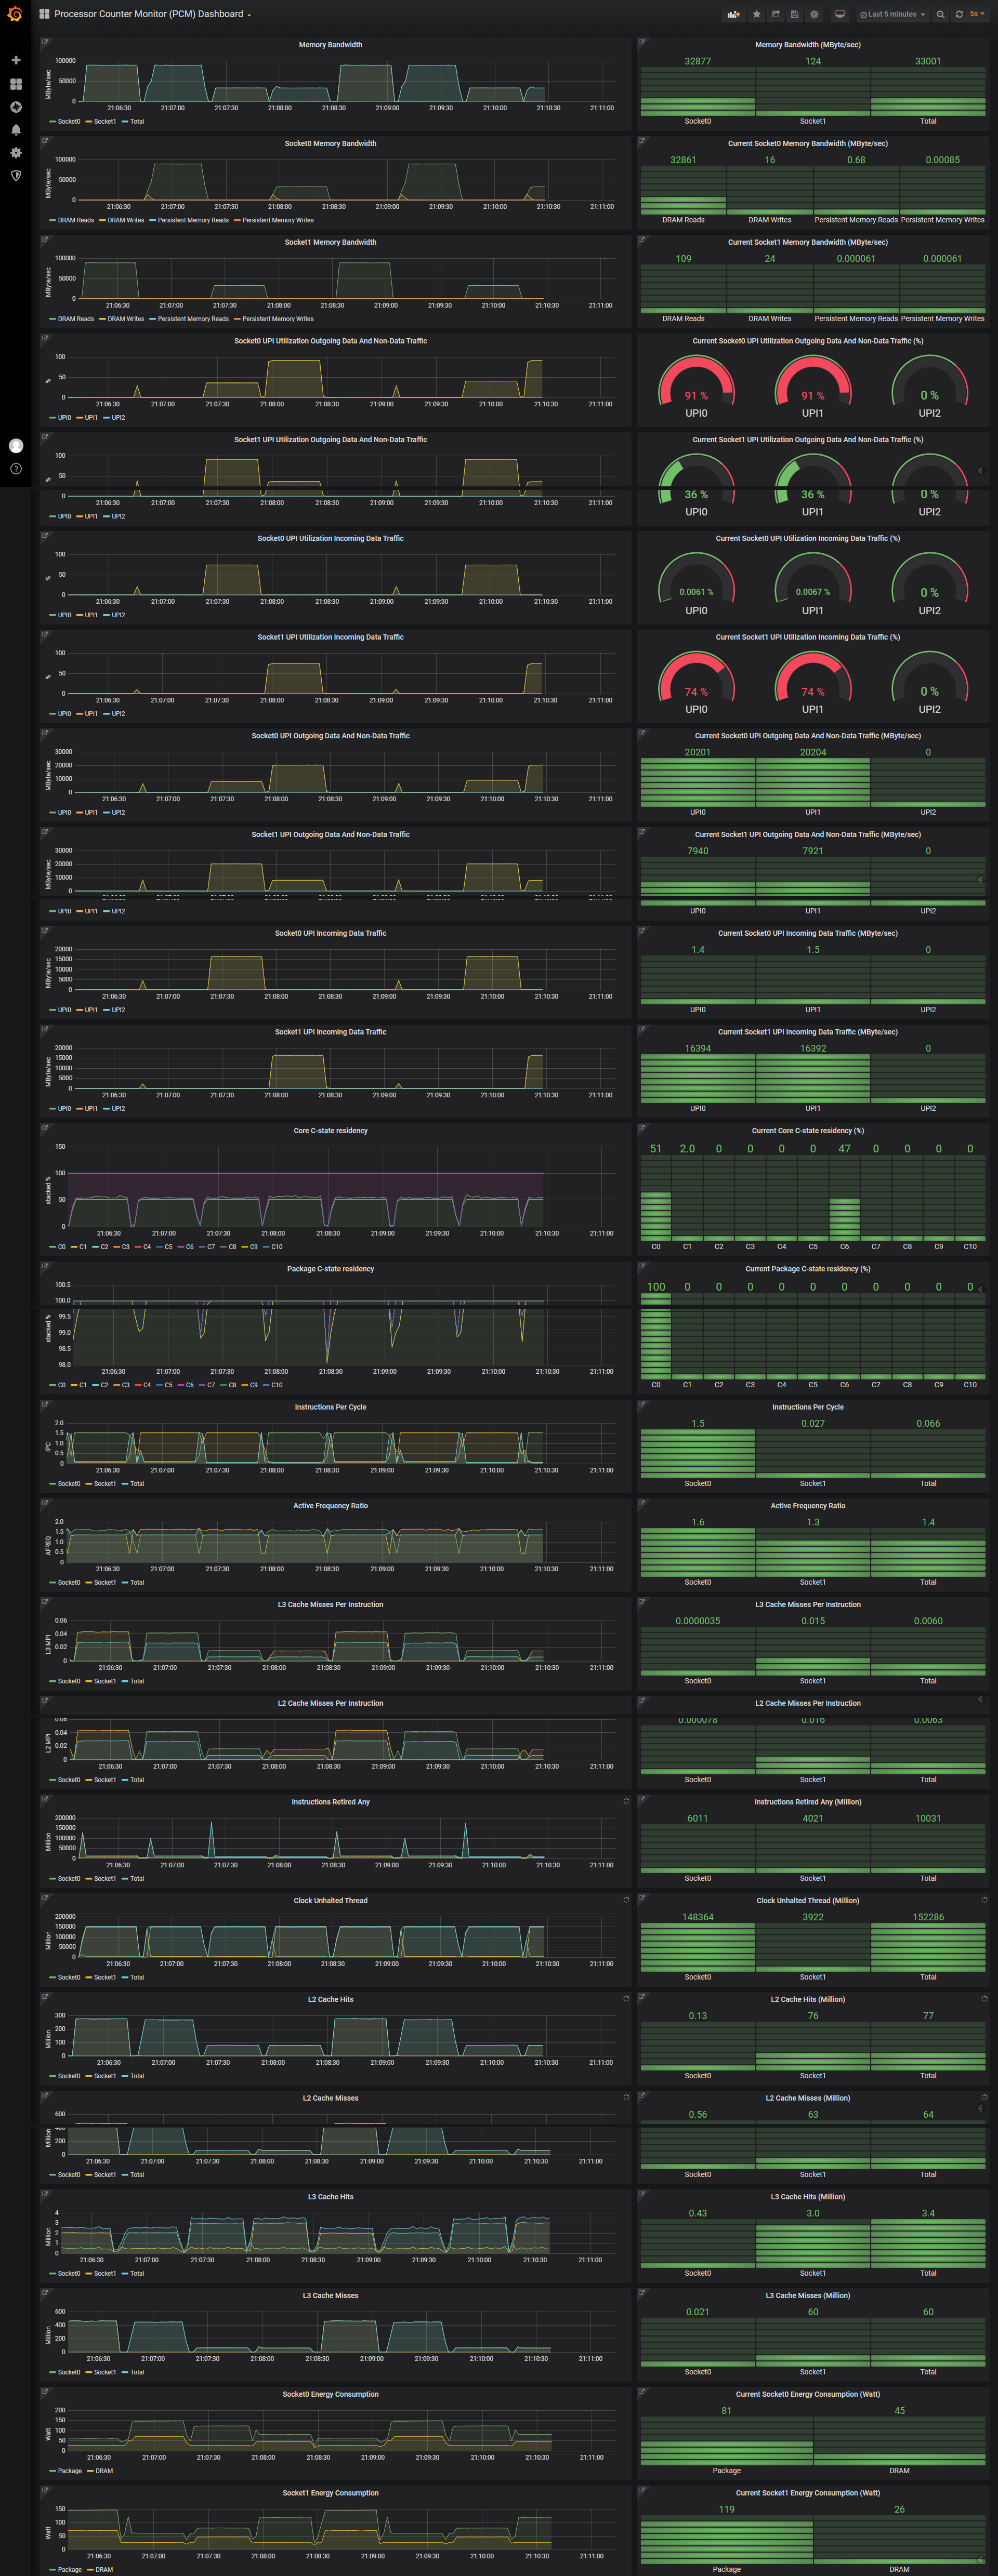
Instructions on How To Run PCM Grafana Dashboard
--------------------------------------------------------------------------------
Installation on target system to be analyzed:
1. Build from the root PCM directory:
```
cd ../.. # if the current location is 'scripts/grafana/'
mkdir build && cd build
cmake .. && make -j$(nproc) pcm-sensor-server
```
2. As root start pcm-sensor-server:
`cd bin && sudo ./pcm-sensor-server`
Alternatively one can start [pcm-sensor-server as a container from docker hub](../../doc/DOCKER_README.md).
Installation of the grafana front-end (can be on any *host* system with connectivity to the target system):
1. Make sure curl and docker are installed on the *host*
2. In PCM source directory on the *host*: `cd scripts/grafana`
3. (Download once and) start docker containers on the *host*: `sudo bash start.sh http://target_system_address:9738`
- `start.sh` script starts telegraf/influxdb/grafana containers
- `start-prometheus.sh` is an alternative script which starts prometheus + grafana containers: `sudo bash start-prometheus.sh target_system_address:9738`
- `start.sh` and `start-prometheus.sh` can also be used to monitor multiple hosts running pcm-sensor-server containers:`sudo bash start.sh targets.txt` or `sudo bash start-prometheus.sh targets.txt`. Here `targets.txt` should be of the following format:
```properties
host1_ipaddress:pcmport
host2_ipaddress:pcmport
.
.
hostn_ipaddress:pcmport
```
- Don't use `localhost` to specify the `target_system_address` if the *host* and the target are the same machine because `localhost` resolves to the own private IP address of the docker container when accessed inside the container. The external IP address or hostname should be used instead.
4. Start your browser at http://*host*:3000/ and then login with admin user, password admin . Change the password and then click on "**Home**" (left top corner) -> "**Dashboards**" -> "Intel® Performance Counter Monitor (Intel® PCM) Dashboard"
5. You can also stop and delete the containers when needed: `sudo bash stop.sh`
|
