1
2
3
4
5
6
7
8
9
10
11
12
13
14
15
16
17
18
19
20
21
22
23
24
25
26
27
28
29
30
31
32
33
34
35
36
37
38
39
40
41
42
43
44
45
46
47
48
49
50
51
52
53
54
55
56
57
58
59
60
61
62
63
64
65
66
67
68
69
70
71
72
73
74
75
76
77
78
79
80
81
82
83
84
85
86
87
88
89
90
91
92
93
94
95
96
97
98
99
100
101
102
103
104
105
106
107
108
109
110
111
112
113
114
115
116
117
118
119
120
121
122
123
124
125
126
127
128
129
130
131
132
133
134
135
136
137
138
139
140
141
142
143
144
145
146
147
148
149
150
151
152
153
154
155
156
157
158
159
160
161
162
163
164
165
166
167
168
169
170
171
172
173
174
175
176
177
178
179
180
181
182
183
184
185
186
187
188
|
`pgsentinel` – sampling active session history
=============================================================
[](https://travis-ci.org/pgsentinel/pgsentinel)
Introduction
------------
PostgreSQL provides session activity. However, in order to gather activity
behavior, users have to sample the pg_stat_activity view multiple times.
`pgsentinel` is an extension to record active session history and link
the activity with query statistics (`pg_stat_statements`).
The module must be loaded by adding `pgsentinel` to
`shared_preload_libraries` in postgresql.conf, which means a server restart
is needed.
When `pgsentinel` is enabled, it collects the history of session activity:
* It's implemented as an in-memory ring buffer where
samples are written with a given (configurable)
period. Therefore, the user can see some number of
recent samples depending on the history size (configurable).
In combination with `pg_stat_statements`, this extension can link the session activity with
query statistics.
To get more granular queries statistics, `pgsentinel` samples the `pg_stat_statements` view:
* at the same time it is sampling the active sessions
* only for the queryid associated to an active session (if any) during the sampling
`pgsentinel` launches a special background worker for gathering session activities.
Availability
------------
`pgsentinel` is implemented as an extension and not available in the default
PostgreSQL installation. It is available from
[github](https://github.com/pgsentinel/pgsentinel)
under the same license as
[PostgreSQL License](https://github.com/pgsentinel/pgsentinel/blob/master/LICENSE)
and supports PostgreSQL 9.6+.
Installation
------------
`pgsentinel` is a PostgreSQL extension which requires PostgreSQL 9.6 or
higher. Before the build and install steps, you should ensure the following:
* PostgreSQL version is 9.6 or higher.
* You have the development package of PostgreSQL installed or you built
PostgreSQL from source.
* Your `PATH` variable configuration includes `pg_config`, or
you've set a value for `PG_CONFIG`.
The typical installation procedure may look like:
As `pgsentinel` uses the `pg_stat_statements` extension (officially bundled with PostgreSQL) for tracking which queries get executed in your database, add the following entries to your postgres.conf:
$ shared_preload_libraries = 'pg_stat_statements,pgsentinel'
$ # Increase the max size of the query strings Postgres records
$ track_activity_query_size = 2048
$ # Track statements generated by stored procedures as well
$ pg_stat_statements.track = all
restart the postgresql daemon and create the extension:
$ git clone https://github.com/pgsentinel/pgsentinel.git
$ cd pgsentinel/src
$ make
$ sudo make install
$ psql DB -c "CREATE EXTENSION pgsentinel;"
Usage
-----
`pgsentinel` reports the active session history activity through the `pg_active_session_history` view:
| Column | Type | Collation | Nullable | Default |
| ------------------ | -------------------------- | ----------- | ---------- | --------- |
| ash_time | timestamp with time zone | | | |
| datid | oid | | | |
| datname | text | | | |
| pid | integer | | | |
| leader_pid | integer | | | |
| usesysid | oid | | | |
| usename | text | | | |
| application_name | text | | | |
| client_addr | text | | | |
| client_hostname | text | | | |
| client_port | integer | | | |
| backend_start | timestamp with time zone | | | |
| xact_start | timestamp with time zone | | | |
| query_start | timestamp with time zone | | | |
| state_change | timestamp with time zone | | | |
| wait_event_type | text | | | |
| wait_event | text | | | |
| state | text | | | |
| backend_xid | xid | | | |
| backend_xmin | xid | | | |
| top_level_query | text | | | |
| query | text | | | |
| cmdtype | text | | | |
| queryid | bigint | | | |
| backend_type | text | | | |
| blockers | integer | | | |
| blockerpid | integer | | | |
| blocker_state | text | | | |
You can see it as samplings of `pg_stat_activity` providing more information:
* `ash_time`: the sampling time
* `top_level_query`: the top level statement (in case PL/pgSQL is used)
* `query`: the statement being executed (not normalised, as it is in `pg_stat_statements`, which means you see parameter values)
* `cmdtype`: the statement type (SELECT,UPDATE,INSERT,DELETE,UTILITY,UNKNOWN,NOTHING)
* `queryid`: the queryid of the statement which links to pg_stat_statements
* `blockers`: the number of blockers
* `blockerpid`: the pid of the blocker (if blockers = 1), the pid of one blocker (if blockers > 1)
* `blocker_state`: state of the blocker (state of the blockerpid)
`pgsentinel` also reports query statistics history through the `pg_stat_statements_history` view:
| Column | Type | Collation | Nullable | Default |
| ------------------ | -------------------------- | ----------- | ---------- | --------- |
| ash_time | timestamp with time zone | | | |
| userid | oid | | | |
| dbid | oid | | | |
| queryid | bigint | | | |
| calls | bigint | | | |
| total_exec_time | double precision | | | |
| rows | bigint | | | |
| shared_blks_hit | bigint | | | |
| shared_blks_read | bigint | | | |
| shared_blks_dirtied | bigint | | | |
| shared_blks_written | bigint | | | |
| local_blks_hit | bigint | | | |
| local_blks_read | bigint | | | |
| local_blks_dirtied | bigint | | | |
| local_blks_written | bigint | | | |
| temp_blks_read | bigint | | | |
| temp_blks_written | bigint | | | |
| blk_read_time | double precision | | | |
| blk_write_time | double precision | | | |
| plans | bigint | | | |
| total_plan_time | double precision | | | |
| wal_records | bigint | | | |
| wal_fpi | bigint | | | |
| wal_bytes | numeric | | | |
The field descriptions are the same as for `pg_stat_statements` (except for the `ash_time` one, which is the time of the active session history sampling).
The worker is controlled by the following GUCs:
| Parameter name | Data type | Description | Default value | Min value |
| ----------------------------------- | --------- | ------------------------------------------- | ------------ | -------- |
| pgsentinel_ash.sampling_period | int4 | Period for history sampling in seconds | 1 | 1 |
| pgsentinel_ash.max_entries | int4 | Size of pg_active_session_history in-memory ring buffer | 1000 | 1000 |
| pgsentinel.db_name | char | database the worker should connect to | postgres | |
| pgsentinel_ash.track_idle_trans | boolean | track session in idle in transaction state | false | |
| pgsentinel_pgssh.max_entries | int4 | Size of pg_stat_statements_history in-memory ring buffer | 1000 | 1000 |
| pgsentinel_pgssh.enable | boolean | enable pg_stat_statements_history | false | |
Remark
-------------------------
* Some fields may be NULL depending on the version (for example, `leader_pid` is NULL for version <= 13.0...)
See how to query the view in this short video
-------------
[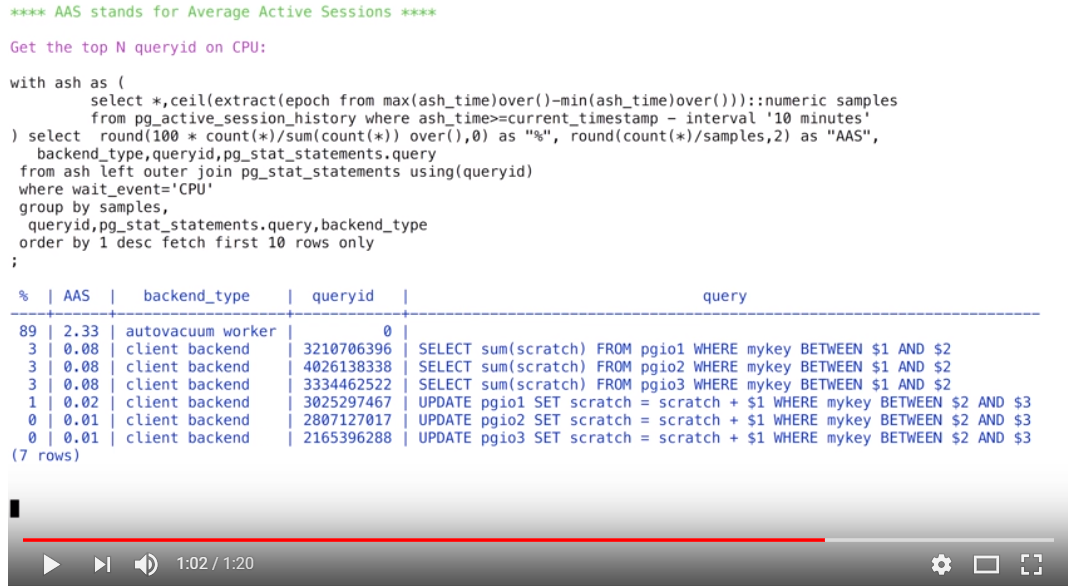](https://www.youtube.com/watch?v=WVKzKjlK75U)
### The videos are available on [youtube](https://www.youtube.com/channel/UCGVciSS2YwnPhtHHGB3Ep3A)
Contribution
------------
If you're lacking some functionality in `pgsentinel` then you're welcome to make pull requests.
Author
-------
* Bertrand Drouvot <bdrouvot@gmail.com>,
France, [Twitter](https://twitter.com/BertrandDrouvot)
|
