1
2
3
4
5
6
7
8
9
10
11
12
13
14
15
16
17
18
19
20
21
22
23
24
25
26
27
28
29
30
31
32
33
34
35
36
37
38
39
40
41
42
43
44
45
46
47
48
49
50
51
52
53
54
55
56
57
58
59
60
61
62
63
64
65
66
67
68
69
70
71
72
73
74
75
76
77
78
79
80
81
82
83
84
85
86
87
88
89
90
91
92
93
94
95
96
97
98
99
100
101
102
103
104
105
106
107
108
109
110
111
112
113
114
115
116
117
118
119
120
121
122
123
124
125
126
127
128
129
130
131
132
133
134
135
136
137
138
139
140
141
142
143
144
145
146
147
148
149
150
151
152
153
154
155
156
157
158
159
160
161
162
163
164
165
166
167
168
169
170
171
172
173
174
175
176
177
178
179
180
181
182
183
184
185
186
187
188
189
190
191
192
193
194
195
196
197
198
199
200
201
202
203
204
205
206
207
208
209
210
211
212
213
214
215
216
217
218
219
220
221
222
223
224
225
226
227
228
229
230
231
232
233
234
235
236
237
238
239
240
241
242
243
244
245
246
247
248
249
250
251
252
253
254
255
256
257
258
259
260
261
262
263
264
265
266
267
268
269
270
271
272
273
274
275
276
277
278
279
280
281
282
283
284
285
286
287
288
289
290
291
292
293
294
295
296
297
298
299
300
301
302
303
304
305
306
307
308
309
310
311
312
313
314
315
316
317
318
319
320
321
322
323
324
325
326
327
328
329
330
331
332
333
334
335
336
337
338
339
340
341
342
343
344
345
346
347
348
349
350
351
352
353
354
355
356
357
358
359
360
361
362
363
364
365
366
367
368
369
370
371
372
373
374
375
376
377
378
379
380
381
382
383
384
385
386
387
388
389
390
391
392
393
394
395
396
397
398
399
400
401
402
403
404
405
406
407
408
409
410
411
412
413
414
415
416
417
418
419
420
421
422
423
424
425
426
427
428
429
430
431
432
433
434
435
436
437
438
439
440
441
442
443
444
445
446
447
448
449
450
451
452
453
454
455
456
457
458
459
460
461
462
463
464
465
466
467
468
469
470
471
472
473
474
475
476
477
478
479
480
481
482
483
484
485
486
487
488
489
490
491
492
493
494
495
496
497
498
499
500
501
502
503
504
505
506
507
508
509
510
511
512
513
514
515
516
517
518
519
520
521
522
523
524
525
526
527
528
529
530
531
532
533
534
535
536
537
538
539
540
541
542
543
544
545
546
547
548
549
550
551
552
553
554
555
556
557
558
559
560
561
562
563
564
565
566
567
568
569
570
571
572
573
574
575
576
577
578
579
580
581
582
583
584
585
586
587
588
589
590
591
592
593
594
595
596
597
598
599
600
601
602
603
604
605
606
607
608
609
610
|
pyinstrument
============
[](https://badge.fury.io/py/pyinstrument)
[](https://github.com/joerick/pyinstrument/actions/workflows/test.yml)
[](https://github.com/joerick/pyinstrument/actions/workflows/wheels.yml)
[Documentation](https://pyinstrument.readthedocs.io/)
<!-- MARK intro start -->
[](https://github.com/joerick/pyinstrument/raw/main/docs/img/screenshot.jpg)
Pyinstrument is a Python profiler. A profiler is a tool to help you optimize
your code - make it faster. To get the biggest speed increase you should
[focus on the slowest part of your program](https://en.wikipedia.org/wiki/Amdahl%27s_law).
Pyinstrument helps you find it!
> ☕️ Not sure where to start? Check out this [video tutorial from calmcode.io](https://calmcode.io/pyinstrument/introduction.html)!
<!-- MARK intro end -->
Installation
------------
<!-- MARK installation start -->
pip install pyinstrument
Pyinstrument supports Python 3.8+.
<!-- MARK installation end -->
> To run Pyinstrument from a git checkout, there's a build step.
Take a look at [Contributing](#contributing) for more info.
Documentation
-------------
To learn how to use pyinstrument, or to check the reference, head to the
[documentation](https://pyinstrument.readthedocs.io/).
Known issues
------------
- Profiling code inside a Docker container can cause some strange results,
because the gettimeofday syscall that pyinstrument uses is slow in that
environment. See [#83](https://github.com/joerick/pyinstrument/issues/83)
- When using `pyinstrument script.py` where `script.py` contains a class
serialized with `pickle`, you might encounter errors because the
serialisation machinery doesn't know where `__main__` is. [See this issue
for workarounds](https://github.com/joerick/pyinstrument/issues/109#issuecomment-722276263)
Changelog
---------
### v5.1.1
_12 August 2025_
- Fix some memory leaks in the low-level C extension (#394)
### v5.1.0
_10 August 2025_
- Precision of printed durations now adapts to the interval of the profile. This allows you to see more detail when the interval, and hides unnecessary detail when the interval is large. (#390)
- Adds an option to the Django middleware to customise the filename of saved profile runs using a callback (#393)
- Adds an aiohttp.web example to the documentation (#389)
### v5.0.3
_2 July 2025_
- Fix a bug where the HTML renderer would crash when the profile is empty (#377)
### v5.0.2
_24 May 2025_
- Fix a bug that caused jupyter notebooks to continue to run after a profiled cell was interrupted with Ctrl-C (#373)
- Fix a type annotation issue when using mypy and import pyinstrument (#373)
### v5.0.1
_23 January 2025_
- Adds a Django option to customise the filename of saved profile runs (#339)
- Improve the FastAPI integration docs (#355)
- Include more options in the IPython magic (#350)
### v5.0.0
_11 October 2024_
Loads of improvements to the HTML renderer!
- Timeline mode - see and zoom into an interactive linear timeline!

- HTML mode now has interactive options, rather than needing to set the upfront.
- Streamlined the design of the HTML page header.
- HTML Call stack view supports arrow key navigation.
- The way ‘library’ code is detected has been changed. Previously, if the string ‘/lib/’ occurred in the file path, that was considered library code (and collapsed by default). Now, pyinstrument captures the paths of the Python install and any active virtualenv/conda env at profile time. Files that are stored there are considered library. That should give fewer false positives.
- Calls to profiler.start() can now pass a target_description parameter, which is displayed in the profile readout.
Check my [blog post](https://joerick.me/posts/2024/10/3/pyinstrument-5/) for more info on the new features.
### v4.7.3
_6 September 2024_
- Fix a bug introduced in 4.7.0 which would cause the profiler to crash when profiling code with unusual locals, notably some pytest extensions (#332)
- Fix a bug that causes pyinstrument to fail to import packages like `glom` on Python 3.12 or later, which mutate the locals() dict. (#336)
- Fix a bug that caused a `UnicodeDecodeError` on some platforms (#330)
- Fix a DivideByZero error that occurs in some situations
- The IPython integration takes greater step to ensure a clean profile output, by ensuring internal frames are trimmed before printing. (#321)
### v4.7.2
_5 August 2024_
- Add CPython 3.13 wheels
- Fix a bug that caused the HTML output to fail to render in some browser contexts (#328)
### v4.7.1
_2 August 2024_
- Fix issue with PyPI upload
### v4.7.0
_1 August 2024_
- Adds a new, convenient API for [profiling chunks of Python code](https://pyinstrument.readthedocs.io/en/latest/guide.html#profile-a-specific-chunk-of-code)! You can now profile simply using a `with` block, or a function/method decorator. This will profile the code and print a short readout into the terminal. (#327)
- Adds new, lower overhead timing options. Pyinstrument calls timers on every Python function call, which is fine on systems with fast timing available, but it adds significant overhead on systems that require a syscall for each, such as some Docker environments. Pyinstrument will now detect slow timers present a warning with two choices. You can enable a 'timing thread', which offloads the timing workload from the profiled thread, or, if you're happy with lower resolution, you can opt to use a 'coarse' timer, which is provided on some Linux systems. (#273)
- Alt-click rows in the HTML output to collapse/expand the whole tree (#325)
- Adds a `flat` argument to the console output, to present a flat list of functions (#294)
- Adds a Litestar example config and docs (#284)
- Preliminary Python 3.13 support (#322)
### v4.6.2
_26 January 2024_
- Fixes a bug with the pstats renderer, where additional frames could be seen in the output. (#287)
- Adds `show_all` option to [Profiler.output_html](https://pyinstrument.readthedocs.io/en/latest/reference.html#pyinstrument.Profiler.output_html)
### v4.6.1
_8 November 2023_
- Fixes a bug with unwanted variable expansion in the IPython magics `%pyinstrument` (#278)
### v4.6.0
_12 October 2023_
- Adds a feature `-c`, which allows profiling code directly from the command line, like `python -c`. (#271)
- Adds a convenience method [`Profiler.write_html`](https://pyinstrument.readthedocs.io/en/latest/reference.html#pyinstrument.Profiler.write_html), for writing HTML output to a file directly. (#266)
### v4.5.3
_7 September 2023_
- Fix a problem in the packaging process that prevented upload to PyPI
### v4.5.2
_1 September 2023_
- Show the program name in the header of the HTML output (#260)
- Improve program name capture through resilience to other programs modifying sys.argv (#258)
- Add support for Python 3.12 (#246)
### v4.5.1
_22 July 2023_
- Fix a bug that caused `[X frames hidden]` in the output when frames were deleted due to `__tracebackhide__` (#255)
- Fix a bug causing built-in code to display the filepath `None` in the console output (#254)
- Some docs improvements (#251)
### v4.5.0
_5 June 2023_
- Adds a flat mode to the console renderer, which can be enabled by passing `-p flat` on the command line. This mode shows the heaviest frame as measured by self-time, which can be useful in some codebases. (#240)
- Adds the ability to save `pstats` files. This is the file format used by cprofile in the stdlib. It's less detailed than pyinstrument profiles, but it's compatible with more tools. (#236)
- Fixes a detail of the `--show-all` option - pyinstrument will no longer remove Python-internal frames when this option is supplied. (#239)
- Internally to the HTML renderer, it now uses Svelte to render the frontend, meaning profile HTML files bundle less javascript and so are smaller. (#222)
### v4.4.0
_5 November 2022_
- Adds the class name to methods in the console & HTML outputs (#203)
- Fix a bug that caused pyinstrument machinery to appear at the start of a profile (#215)
- Frames that set a `__traceback_hide__` local variable will now be removed from the output (#217)
- Jupyter/IPython magic now supports async/await, if you run with a `--async_mode=enabled` flag. (#212)
- Fix a crash when more than one root frame is captured in a thread - this can happen with gevent.
- A big refactor to the backend, allowing more than just static information to be captured. This currently is just powering the class name feature, but more is to come!
### v4.3.0
_21 August 2022_
- Adds buttons in the HTML output to switch between absolute and
proportional (percentage) time.
- Adds a command line flag `--interval` (seconds, default 0.001) to change the interval that
pyinstrument samples a program. This is useful for long-running programs,
where increasing the interval reduces the memory overhead.
- Includes wheels for CPython 3.11.
### v4.2.0
- Adds a command-line option `-p` `--render-option` that allows arbitrary
setting of render options. This lets you set options like
`filter_threshold` from the command line, by doing something like
`pyinstrument -p processor_options.filter_threshold=0`.
Here's the help output for the option:
```
-p RENDER_OPTION, --render-option=RENDER_OPTION
options to pass to the renderer, in the format
'flag_name' or 'option_name=option_value'. For
example, to set the option 'time', pass '-p
time=percent_of_total'. To pass multiple options, use
the -p option multiple times. You can set processor
options using dot-syntax, like '-p
processor_options.filter_threshold=0'. option_value is
parsed as a JSON value or a string.
```
- Adds the ability to view times in the console output as percentages,
rather than absolute times. Use the ConsoleRenderer option
`time='percent_of_total'`, or on the command line, use `-p`, like
`pyinstrument -p time=percent_of_total`.
- Adds command line options for loading and saving pyinstrument sessions.
You can save the raw data for a pyinstrument session with `-r session`,
like `pyinstrument -r session -o session.pyisession myscript.py`. Loading
is via `--load`, e.g. `pyinstrument --load session.pyisession`.
- Command line output format is inferred from the `-o` output file
extension. So if you do `pyinstrument -o profile.html myscript.py`, you
don't need to supply `-r html`, pyinstrument will automatically use the
HTML renderer. Or if you do
`pyinstrument -o profile.pyisession myscript.py`, it will save a raw
session object.
- Adds [usage examples for FastAPI and pytest](https://pyinstrument.readthedocs.io/en/latest/guide.html#profile-a-web-request-in-fastapi) to the documentation.
- Fixes a bug causing NotImplementedError when using `async_mode=strict`.
- Adds support for Python 3.11
### v4.1.1
- Fixed an issue causing PYINSTRUMENT_PROFILE_DIR_RENDERER to output the
wrong file extension when used with the speedscope renderer.
### v4.1.0
- You can now use pyinstrument natively in an IPython notebook! Just use
`%load_ext pyinstrument` at the top of your notebook, and then
`%%pyinstrument` in the cell you want to profile.
- Added support for the [speedscope](https://www.speedscope.app/) format.
This provides a way to view interactive flamecharts using pyinstrument. To
use, profile with `pyinstrument -r speedscope`, and upload to the
speedscope web app.
- You can now configure renderers for the Django middleware file output,
using the `PYINSTRUMENT_PROFILE_DIR_RENDERER` option.
- Added wheels for Linux aarch64 (64-bit ARM).
### v4.0.4
- Fix a packaging issue where a package called 'test' was installed
alongside pyinstrument
- Use more modern C APIs to resolve deprecation warnings on Python 3.10.
- Minor docs fixes
### v4.0.3
- CPython 3.10 support
- Improve error messages when trying to use Profiler from multiple threads
- Fix crash when rendering sessions that contain a module in a FrameGroup
### v4.0.2
- Fix some packaging issues
### v4.0.0
- Async support! Pyinstrument now detects when an async task hits an await,
and tracks time spent outside of the async context under this await.
So, for example, here's a simple script with an async task that does a
sleep:
```python
import asyncio
from pyinstrument import Profiler
async def main():
p = Profiler(async_mode='disabled')
with p:
print('Hello ...')
await asyncio.sleep(1)
print('... World!')
p.print()
asyncio.run(main())
```
Before Pyinstrument 4.0.0, we'd see only time spent in the run loop, like
this:
```
_ ._ __/__ _ _ _ _ _/_ Recorded: 18:33:03 Samples: 2
/_//_/// /_\ / //_// / //_'/ // Duration: 1.006 CPU time: 0.001
/ _/ v3.4.2
Program: examples/async_example_simple.py
1.006 _run_once asyncio/base_events.py:1784
└─ 1.005 select selectors.py:553
[3 frames hidden] selectors, <built-in>
1.005 kqueue.control <built-in>:0
```
Now, with pyinstrument 4.0.0, we get:
_ ._ __/__ _ _ _ _ _/_ Recorded: 18:30:43 Samples: 2
/_//_/// /_\ / //_// / //_'/ // Duration: 1.007 CPU time: 0.001
/ _/ v4.0.0
Program: examples/async_example_simple.py
1.006 main async_example_simple.py:4
└─ 1.005 sleep asyncio/tasks.py:641
[2 frames hidden] asyncio
1.005 [await]
For more information, check out the [async profiling documentation] and
the [Profiler.async_mode] property.
- Pyinstrument has a [documentation site], including full Python API docs!
[async profiling documentation]: https://pyinstrument.readthedocs.io/en/latest/how-it-works.html#async-profiling
[Profiler.async_mode]: https://pyinstrument.readthedocs.io/en/latest/reference.html#pyinstrument.Profiler.async_mode
[documentation site]: https://pyinstrument.readthedocs.io
### v3.4.2
- Fix a bug that caused `--show`, `--show-regex`, `--show-all` to be ignored
on the command line.
### v3.4.1
- Under-the-hood modernisation
### v3.4.0
- Added `timeline` option (boolean) to Profiler methods `output_html()` and
`open_in_browser()`.
### v3.3.0
- Fixed issue with `pyinstrument -m module`, where pyinstrument wouldn't find
modules in the current directory.
- Dropped support for Python 2.7 and 3.5. Old versions will remain available
on PyPI, and pip should choose the correct one automatically.
### v3.2.0
- Added the ability to track time in C functions. Minor note - Pyinstrument
will record time spent C functions as 'leaf' functions, due to a limitation
in how Python records frames. `Python -> C -> Python` is recorded as
`Python -> Python`, but `Python -> Python -> C` will be attributed correctly.
(#103)
### v3.1.2
- Fix `<__array_function__ internals>` frames appearing as app code in reports
### v3.1.1
- Added support for timeline mode on HTML and JSON renderers
- Released as a tarball as well as a universal wheel
### v3.1.0
- Added PYINSTRUMENT_SHOW_CALLBACK option on the Django middleware to
add a condition to showing the profile (could be used to run pyinstrument
on a live server!)
- Fixed bug in the Django middleware where file would not be written because
of a unicode error
### v3.0.3
- Fixed bug with the Django middleware on Windows where profiling would fail
because we were trying to put an illegal character '?' in the profile path.
(#66)
### v3.0.2
- Add `--show` and `--show-regex` options, to mark certain files to be
displayed. This helps to profile inside specific modules, while hiding
others. For example, `pyinstrument --show '*/sympy/*' script.py`.
### v3.0.1
- Fix #60: pass all arguments after -m module_name to the called module
- Fix crash during HTML/JSON output when no frames were captured.
### v3.0.0
- Pyinstrument will now hide traces through libraries that you're using by default. So instead of showing you loads of frames going through the internals of something external e.g. urllib, it lets you focus on your code.
| Before | After |
| --- | ---
|  |  |
To go back to the old behaviour, use `--show-all` on the command line.
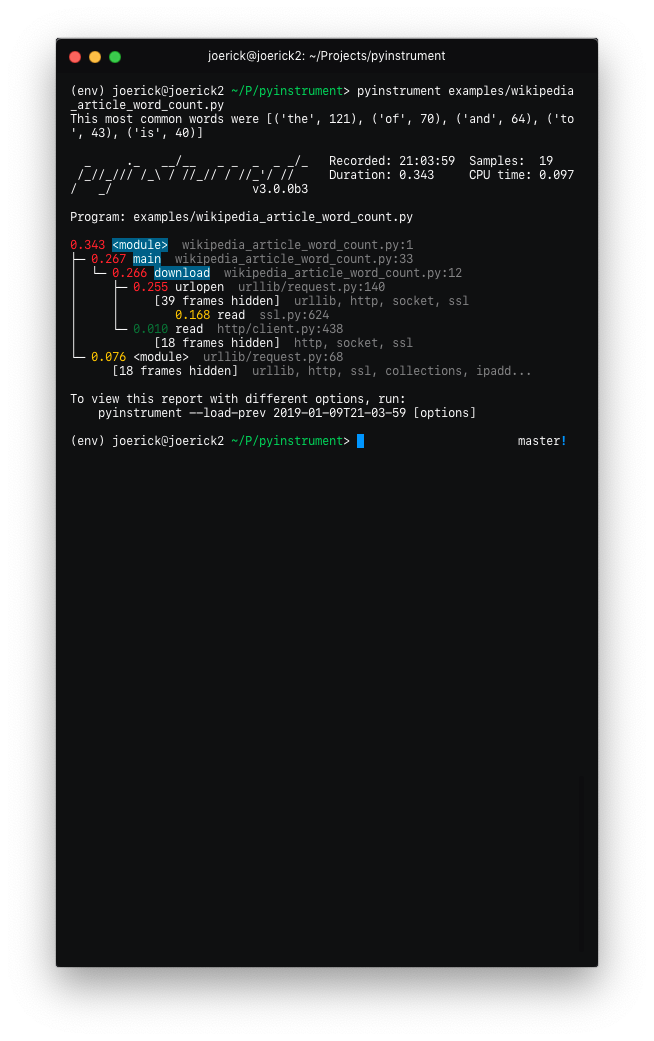
- 'Entry' frames of hidden groups are shown, so you know which call is the problem
- Really slow frames in the groups are shown too, e.g. the 'read' call on the socket
- Application code is highlighted in the console
- Additional metrics are shown at the top of the trace - timestamp, number of samples, duration, CPU time
- Hidden code is controlled by the `--hide` or `--hide-regex` options - matching on the path of the code files.
```
--hide=EXPR glob-style pattern matching the file paths whose
frames to hide. Defaults to '*/lib/*'.
--hide-regex=REGEX regex matching the file paths whose frames to hide.
Useful if --hide doesn't give enough control.
```
- Outputting a timeline is supported from the command line.
```
-t, --timeline render as a timeline - preserve ordering and don't
condense repeated calls
```
- Because there are a few rendering options now, you can load a previous profiling session using `--load-prev` - pyinstrument keeps the last 10 sessions.
- Hidden groups can also call back into application code, that looks like this:

- (internal) When recording timelines, frame trees are completely linear now, allowing
for the creation of super-accurate frame charts.
- (internal) The HTML renderer has been rewritten as a Vue.js app. All the console improvements apply to the HTML output too, plus it's interactive.
- (internal) A lot of unit and integration tests added!
Yikes! See #49 for the gory details. I hope you like it.
### v2.3.0
- Big refactor!
- `Recorders` have been removed. The frame recording is now internal to the `Profiler` object.
This means the 'frame' objects are more general-purpose, which paves the way for...
- Processors! These are functions that mutate the tree to sculpt the output.
They are used by the renderers to filter the output to the correct form. Now, instead of
a time-aggregating recorder, the profiler just uses timeline-style recording (this is
lower-overhead anyway) and the aggregation is done as a processing step.
- The upshot of this is that it's now way easier to alter the tree to filter stuff out, and
do more advanced things like combining frames that we don't care about. More features to
come that use this in v3.0!
- Importlib frames are removed - you won't see them at all. Their children are retained, so
imports are just transparent.
- Django profile file name is now limited to a hundred of characters (#50)
- Fix bug with --html option (#53)
- Add `--version` command line option
### v2.2.1
- Fix crash when using on the command line.
### v2.2.0
- Added support for JSON output. Use `pyinstrument --renderer=json scriptfile.py`.
[PR](https://github.com/joerick/pyinstrument/pull/46)
- [@iddan](https://github.com/iddan) has put together an
[interactive viewer](https://python-flame-chart.netlify.com/) using the JSON output!

- When running `pyinstrument --html` and you don't pipe the output to a file, pyinstrument will write the console output to a temp file and open that in a browser.
### v2.1.0
- Added support for running modules with pyinstrument via the command line. The new syntax
is the `-m` flag e.g. `pyinstrument -m module_name`! [PR](https://github.com/joerick/pyinstrument/pull/45#pullrequestreview-143383557)
### v2.0.4
- Fix crashes due to multi-threaded use of pyinstrument. The fix is in the C extension,
over at https://github.com/joerick/pyinstrument_cext/pull/3
### v2.0.3
- Pyinstrument can now be used in a `with` block.
For example:
profiler = pyinstrument.Profiler()
with profiler:
# do some work here...
print(profiler.output_text())
- Middleware fix for older versions of Django
### v2.0.2
- Fix for max recursion error when used to profile programs with a lot of frames on the stack.
### v2.0.1
- Ensure license is included in the sdist.
### v2.0.0
- **Pyinstrument uses a new profiling mode**. Rather than using
signals, pyintrument uses a new statistical profiler built on
PyEval_SetProfile. This means no more main thread restriction, no more
IO errors when using Pyinstrument, and no need for a separate more
'setprofile' mode!
- **Renderers**. Users can customize Pyinstrument to use alternative renderers
with the `renderer` argument on `Profiler.output()`, or using the `--renderer`
argument on the command line.
- **Recorders**. To support other use cases of Pyinstrument (e.g. flame charts),
pyinstrument now has a 'timeline' recorder mode. This mode records captured
frames in a linear way, so the program execution can be viewed on a
timeline.
### v0.13
- `pyinstrument` command. You can now profile python scripts from the shell
by running `$ pyinstrument script.py`. This is now equivalent to
`python -m pyinstrument`. Thanks @asmeurer!
### v0.12
- Application code is highlighted in HTML traces to make it easier to spot
- Added `PYINSTRUMENT_PROFILE_DIR` option to the Django interface, which
will log profiles of all requests to a file the specified folder. Useful
for profiling API calls.
- Added `PYINSTRUMENT_USE_SIGNAL` option to the Django interface, for use
when signal mode presents problems.
Contributing
------------
To setup a dev environment:
virtualenv --python=python3 env
. env/bin/activate
pip install --upgrade pip
pip install -r requirements-dev.txt
pre-commit install --install-hooks
To get some sample output:
pyinstrument examples/wikipedia_article_word_count.py
To run the tests:
pytest
To run linting checks locally:
pre-commit run --all-files
Some of the pre-commit checks, like `isort` or `black`, will auto-fix
the problems they find. So if the above command returns an error, try
running it again, it might succeed the second time :)
Running all the checks can be slow, so you can also run checks
individually, e.g., to format source code that fails `isort` or `black`
checks:
pre-commit run --all-files isort
pre-commit run --all-files black
To diagnose why `pyright` checks are failing:
pre-commit run --all-files pyright
### The HTML renderer Vue.js app
The HTML renderer works by embedding a JSON representation of the sample with
a Javascript 'bundle' inside an HTML file that can be viewed in any web
browser.
To edit the html renderer style, do:
cd html_renderer
npm ci
npm run serve
When launched without a top-level `window.profileSession` object, it will
fetch a sample profile so you can work with it.
To compile the JS app and bundle it back into the pyinstrument python tool:
bin/build_js_bundle.py [--force]
|
