1
2
3
4
5
6
7
8
9
10
11
12
13
14
15
16
17
18
19
20
21
22
23
24
25
26
27
28
29
30
31
32
33
34
35
36
37
38
39
40
41
42
43
44
45
46
47
48
49
50
51
52
53
54
55
56
57
58
59
60
61
62
63
64
65
66
67
68
69
70
71
72
73
74
75
76
77
78
79
80
81
82
83
84
85
86
87
88
89
90
91
92
93
94
95
96
97
98
99
100
101
102
103
104
105
106
107
108
109
110
111
112
113
114
115
116
117
118
119
120
121
122
123
124
125
126
127
128
129
130
131
132
133
134
135
136
137
|
# PythonQwt: Qt plotting widgets for Python
[](./LICENSE)
[](https://pypi.org/project/PythonQwt/)
[](https://github.com/PlotPyStack/PythonQwt)
[](https://pypi.python.org/pypi/PythonQwt/)
[](https://www.anaconda.com/download/)
[](https://pythonqwt.readthedocs.io/en/latest/?badge=latest)
ℹ️ Created in 2014 by Pierre Raybaut and maintained by the [PlotPyStack](https://github.com/PlotPyStack) organization.
The `PythonQwt` project was initiated to solve -at least temporarily- the obsolescence issue of `PyQwt` (the Python-Qwt C++ bindings library) which is no longer maintained. The idea was to translate the original Qwt C++ code to Python and then to optimize some parts of the code by writing new modules based on NumPy and other libraries.
The `PythonQwt` package consists of a single Python package named `qwt` and of a few other files (examples, doc, ...).
See documentation [online](https://pythonqwt.readthedocs.io/en/latest/) or [PDF](https://pythonqwt.readthedocs.io/_/downloads/en/latest/pdf/) for more details on the library and [changelog](CHANGELOG.md) for recent history of changes.
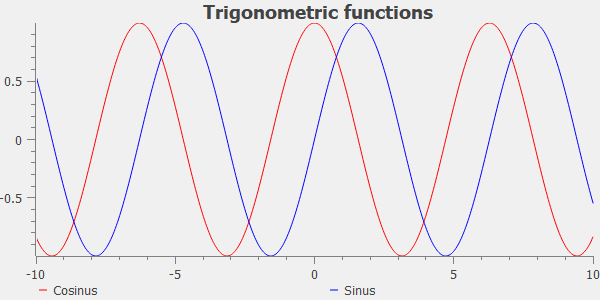
## Sample
```python
import numpy as np
from qtpy import QtWidgets as QW
import qwt
app = QW.QApplication([])
# Create plot widget
plot = qwt.QwtPlot("Trigonometric functions")
plot.insertLegend(qwt.QwtLegend(), qwt.QwtPlot.BottomLegend)
# Create two curves and attach them to plot
x = np.linspace(-10, 10, 500)
qwt.QwtPlotCurve.make(x, np.cos(x), "Cosine", plot, linecolor="red", antialiased=True)
qwt.QwtPlotCurve.make(x, np.sin(x), "Sine", plot, linecolor="blue", antialiased=True)
# Resize and show plot
plot.resize(600, 300)
plot.show()
app.exec_()
```
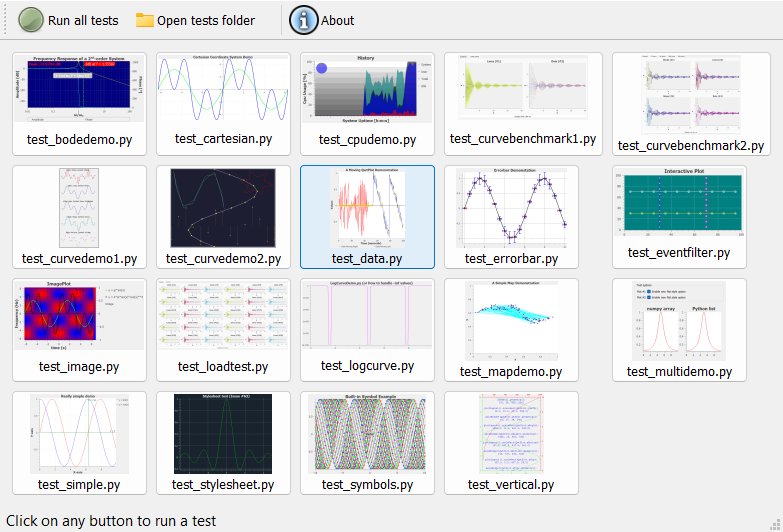
## Examples (tests)
The GUI-based test launcher may be executed from Python:
```python
from qwt import tests
tests.run()
```
or from the command line:
```bash
PythonQwt
```
Tests may also be executed in unattended mode:
```bash
PythonQwt-tests --mode unattended
```
## Overview
The `qwt` package is a pure Python implementation of `Qwt` C++ library with the following limitations.
The following `Qwt` classes won't be reimplemented in `qwt` because more powerful features already exist in `guiqwt`: `QwtPlotZoomer`, `QwtCounter`, `QwtEventPattern`, `QwtPicker`, `QwtPlotPicker`.
Only the following plot items are currently implemented in `qwt` (the only plot items needed by `guiqwt`): `QwtPlotItem` (base class), `QwtPlotItem`, `QwtPlotMarker`, `QwtPlotSeriesItem` and `QwtPlotCurve`.
See "Overview" section in [documentation](https://pythonqwt.readthedocs.io/en/latest/) for more details on API limitations when comparing to Qwt.
## Roadmap
The `qwt` package short-term roadmap is the following:
- [X] Drop support for PyQt4 and PySide2
- [X] Drop support for Python <= 3.8
- [X] Replace `setup.py` by `pyproject.toml`, using `setuptools` (e.g. see `guidata`)
- [ ] Add more unit tests: the ultimate goal is to reach 90% code coverage
## Dependencies and installation
### Supported Qt versions and bindings
The whole PlotPyStack set of libraries relies on the [Qt](https://doc.qt.io/) GUI toolkit, thanks to [QtPy](https://pypi.org/project/QtPy/), an abstraction layer which allows to use the same API to interact with different Python-to-Qt bindings (PyQt5, PyQt6, PySide2, PySide6).
Compatibility table:
| PythonQwt version | PyQt5 | PyQt6 | PySide2 | PySide6 |
|-------------------|-------|-------|---------|---------|
| 0.16 and earlier | ✅ | ⚠️ | ❌ | ⚠️ |
| Latest | ✅ | ✅ | ❌ | ✅ |
### Requirements
- Python >=3.9
- QtPy >= 1.3 (and a Python-to-Qt binding library, see above)
- NumPy >= 1.5
### Optional dependencies
- coverage, pytest (for unit tests)
- sphinx (for documentation generation)
### Installation
From the source package:
```bash
python -m build
```
## Copyrights
### Main code base
- Copyright © 2002 Uwe Rathmann, for the original Qwt C++ code
- Copyright © 2015 Pierre Raybaut, for the Qwt C++ to Python translation and optimization
- Copyright © 2015 Pierre Raybaut, for the PythonQwt specific and exclusive Python material
### Some examples
- Copyright © 2003-2009 Gerard Vermeulen, for the original PyQwt code
- Copyright © 2015 Pierre Raybaut, for the PyQt5/PySide port and further developments (e.g. ported to PythonQwt API)
## License
The `qwt` Python package was partly (>95%) translated from Qwt C++ library: the associated code is distributed under the terms of the LGPL license. The rest of the code was either wrote from scratch or strongly inspired from MIT licensed third-party software.
See included [LICENSE](LICENSE) file for more details about licensing terms.
|
