1
2
3
4
5
6
7
8
9
10
11
12
13
14
15
16
17
18
19
20
21
22
23
24
25
26
27
28
29
30
31
32
33
34
35
36
37
38
39
40
41
42
43
44
45
46
47
|
# Example for redis-py OpenTelemetry instrumentation
This example demonstrates how to monitor Redis using [OpenTelemetry](https://opentelemetry.io/) and
[Uptrace](https://github.com/uptrace/uptrace). It requires Docker to start Redis Server and Uptrace.
See
[Monitoring redis-py performance with OpenTelemetry](https://redis.readthedocs.io/en/latest/opentelemetry.html)
for details.
**Step 1**. Download the example using Git:
```shell
git clone https://github.com/redis/redis-py.git
cd example/opentelemetry
```
**Step 2**. Optionally, create a virtualenv:
```shell
python3 -m venv .venv
source .venv/bin/active
```
**Step 3**. Install dependencies:
```shell
pip install -e .
```
**Step 4**. Start the services using Docker and make sure Uptrace is running:
```shell
docker-compose up -d
docker-compose logs uptrace
```
**Step 5**. Run the Redis client example and follow the link from the CLI to view the trace:
```shell
python3 main.py
trace: http://localhost:14318/traces/ee029d8782242c8ed38b16d961093b35
```
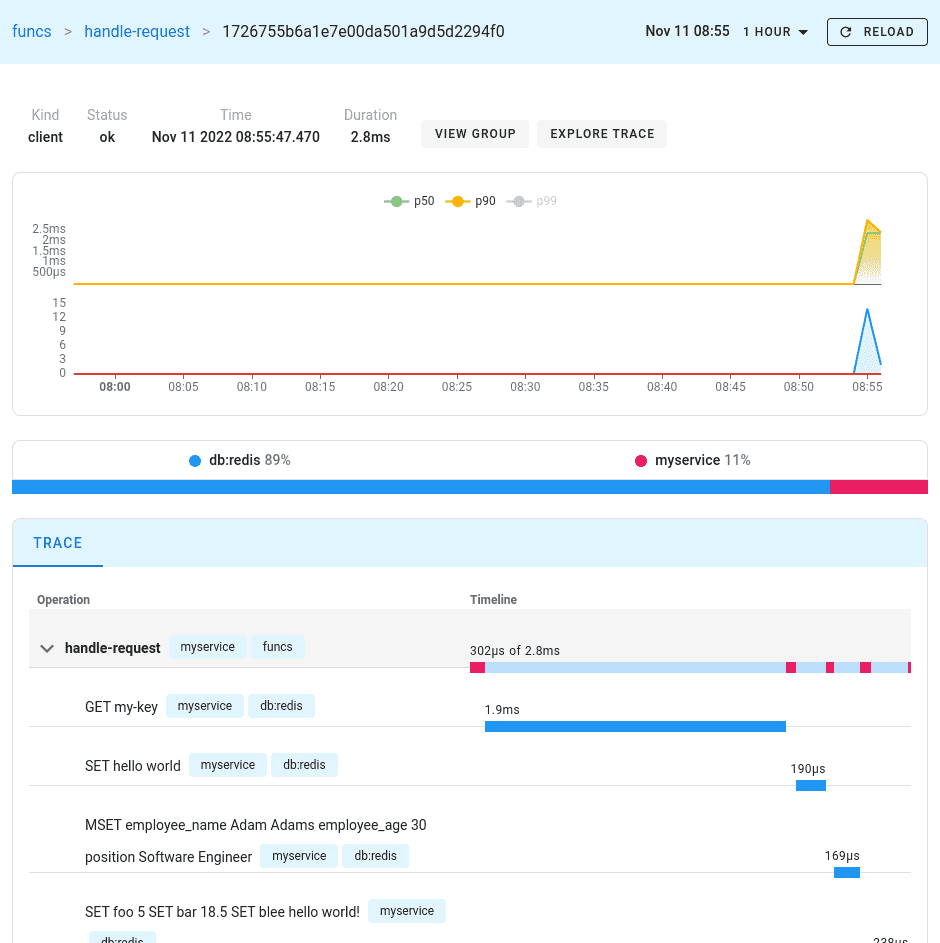
You can also open Uptrace UI at [http://localhost:14318](http://localhost:14318) to view available
spans, logs, and metrics.
|
