1
2
3
4
5
6
7
8
9
10
11
12
13
14
15
16
17
18
19
20
21
22
23
24
25
26
27
28
29
30
31
32
33
34
35
36
37
38
39
40
41
42
43
44
45
46
47
48
49
50
51
52
53
54
55
56
57
58
59
60
61
62
63
64
65
66
67
68
69
70
71
72
73
74
75
76
77
78
79
80
81
82
83
84
85
86
87
88
89
90
91
92
93
94
95
96
97
98
99
100
101
102
103
104
105
106
107
108
109
110
111
112
113
114
115
116
117
118
119
120
121
122
123
124
125
126
127
128
129
130
131
132
133
134
135
136
137
138
139
140
141
142
143
144
145
146
147
148
149
150
151
152
153
154
155
156
157
158
159
160
161
162
163
164
165
166
167
168
169
170
171
172
173
174
175
176
177
178
179
180
181
182
183
184
185
186
187
188
189
190
191
192
193
194
195
196
197
198
199
200
201
202
203
204
205
206
207
208
209
210
211
212
213
214
215
216
217
218
219
220
221
222
223
224
225
226
227
228
229
230
231
232
233
234
235
236
237
238
239
240
241
242
243
244
245
246
247
248
249
250
251
252
253
254
255
256
257
258
259
260
261
262
263
264
265
266
267
268
269
270
271
272
273
274
275
276
277
278
279
280
281
282
283
284
285
286
287
288
289
290
291
292
293
294
295
296
297
298
299
300
301
302
303
304
305
306
307
308
309
310
311
312
313
314
315
316
317
318
319
320
321
322
323
|
---
title: "Formating with xlsx"
author: "Alexander Walker, Philipp Schauberger"
date: "`r Sys.Date()`"
output: rmarkdown::html_vignette
vignette: >
%\VignetteIndexEntry{Formating with xlsx}
%\VignetteEngine{knitr::rmarkdown}
%\VignetteEncoding{UTF-8}
---
## Formatting with writeData and writeDataTable
```{r setup, include = FALSE}
library(openxlsx)
```
```{r include = TRUE, eval = FALSE, highlight = TRUE}
## data.frame to write
df <- data.frame("Date" = Sys.Date()-0:4,
"Logical" = c(TRUE, FALSE, TRUE, TRUE, FALSE),
"Currency" = paste("$",-2:2),
"Accounting" = -2:2,
"hLink" = "https://CRAN.R-project.org/",
"Percentage" = seq(-1, 1, length.out=5),
"TinyNumber" = runif(5) / 1E9, stringsAsFactors = FALSE)
class(df$Currency) <- "currency"
class(df$Accounting) <- "accounting"
class(df$hLink) <- "hyperlink"
class(df$Percentage) <- "percentage"
class(df$TinyNumber) <- "scientific"
## Formatting can be applied simply through the write functions
## global options can be set to further simplify things
options("openxlsx.borderStyle" = "thin")
options("openxlsx.borderColour" = "#4F81BD")
## create a workbook and add a worksheet
wb <- createWorkbook()
addWorksheet(wb, "writeData auto-formatting")
writeData(wb, 1, df, startRow = 2, startCol = 2)
writeData(wb, 1, df, startRow = 9, startCol = 2, borders = "surrounding")
writeData(wb, 1, df, startRow = 16, startCol = 2, borders = "rows")
writeData(wb, 1, df, startRow = 23, startCol = 2, borders ="columns")
writeData(wb, 1, df, startRow = 30, startCol = 2, borders ="all")
## headerStyles
hs1 <- createStyle(fgFill = "#4F81BD", halign = "CENTER", textDecoration = "Bold",
border = "Bottom", fontColour = "white")
writeData(wb, 1, df, startRow = 16, startCol = 10, headerStyle = hs1,
borders = "rows", borderStyle = "medium")
## to change the display text for a hyperlink column just write over those cells
writeData(wb, sheet = 1, x = paste("Hyperlink", 1:5), startRow = 17, startCol = 14)
## writing as an Excel Table
addWorksheet(wb, "writeDataTable")
writeDataTable(wb, 2, df, startRow = 2, startCol = 2)
writeDataTable(wb, 2, df, startRow = 9, startCol = 2, tableStyle = "TableStyleLight9")
writeDataTable(wb, 2, df, startRow = 16, startCol = 2, tableStyle = "TableStyleLight2")
writeDataTable(wb, 2, df, startRow = 23, startCol = 2, tableStyle = "TableStyleMedium21")
openXL(wb) ## opens a temp version
```
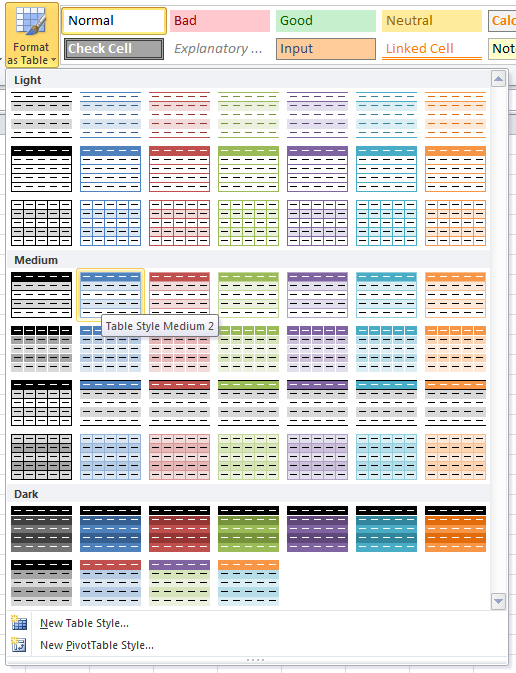
## Use of pre-defined table styles
The 'tableStyle' argument in writeDataTable can be any of the predefined tableStyles in Excel.
## Date Formatting
```{r include = TRUE, eval = FALSE, highlight = TRUE}
# data.frame of dates
dates <- data.frame("d1" = Sys.Date() - 0:4)
for(i in 1:3) dates <- cbind(dates, dates)
names(dates) <- paste0("d", 1:8)
## Date Formatting
wb <- createWorkbook()
addWorksheet(wb, "Date Formatting", gridLines = FALSE)
writeData(wb, 1, dates) ## write without styling
## openxlsx converts columns of class "Date" to Excel dates with the format given by
getOption("openxlsx.dateFormat", "mm/dd/yyyy")
## this can be set via (for example)
options("openxlsx.dateFormat" = "yyyy/mm/dd")
## custom date formats can be made up of any combination of:
## d, dd, ddd, dddd, m, mm, mmm, mmmm, mmmmm, yy, yyyy
## numFmt == "DATE" will use the date format specified by the above
addStyle(wb, 1, style = createStyle(numFmt = "DATE"), rows = 2:11, cols = 1, gridExpand = TRUE)
## some custom date format examples
sty <- createStyle(numFmt = "yyyy/mm/dd")
addStyle(wb, 1, style = sty, rows = 2:11, cols = 2, gridExpand = TRUE)
sty <- createStyle(numFmt = "yyyy/mmm/dd")
addStyle(wb, 1, style = sty, rows = 2:11, cols = 3, gridExpand = TRUE)
sty <- createStyle(numFmt = "yy / mmmm / dd")
addStyle(wb, 1, style = sty, rows = 2:11, cols = 4, gridExpand = TRUE)
sty <- createStyle(numFmt = "ddddd")
addStyle(wb, 1, style = sty, rows = 2:11, cols = 5, gridExpand = TRUE)
sty <- createStyle(numFmt = "yyyy-mmm-dd")
addStyle(wb, 1, style = sty, rows = 2:11, cols = 6, gridExpand = TRUE)
sty <- createStyle(numFmt = "mm/ dd yyyy")
addStyle(wb, 1, style = sty, rows = 2:11, cols = 7, gridExpand = TRUE)
sty <- createStyle(numFmt = "mm/dd/yy")
addStyle(wb, 1, style = sty, rows = 2:11, cols = 8, gridExpand = TRUE)
setColWidths(wb, 1, cols = 1:10, widths = 23)
## The default date format used in writeData and writeDataTable can be set with:
options("openxlsx.dateFormat" = "dd/mm/yyyy")
writeData(wb, "Date Formatting", dates, startRow = 8, borders = "rows")
options("openxlsx.dateFormat" = "yyyy-mm-dd")
writeData(wb, "Date Formatting", dates, startRow = 15)
saveWorkbook(wb, "Date Formatting.xlsx", overwrite = TRUE)
```
## DateTime Formatting
The conversion from POSIX to Excel datetimes is dependent on the timezone you are in.
If POSIX values are being written incorrectly, try setting the timezone with (for example)
```{r include = TRUE, eval = FALSE, highlight = TRUE}
Sys.setenv(TZ = "Australia/Sydney")
dateTimes <- data.frame("d1" = Sys.time() - 0:4*10000)
for(i in 1:2) dateTimes <- cbind(dateTimes, dateTimes)
names(dateTimes) <- paste0("d", 1:4)
## POSIX Formatting
wb <- createWorkbook()
addWorksheet(wb, "DateTime Formatting", gridLines = FALSE)
writeData(wb, 1, dateTimes) ## write without styling
## openxlsx converts columns of class "POSIxt" to Excel datetimes with the format given by
getOption("openxlsx.datetimeFormat", "yyyy/mm/dd hh:mm:ss")
## this can be set via (for example)
options("openxlsx.datetimeFormat" = "yyyy-mm-dd hh:mm:ss")
## custom datetime formats can be made up of any combination of:
## d, dd, ddd, dddd, m, mm, mmm, mmmm, mmmmm, yy, yyyy, h, hh, m, mm, s, ss, AM/PM
## numFmt == "LONGDATE" will use the date format specified by the above
long_date_style <- createStyle(numFmt = "LONGDATE")
addStyle(wb, 1, style = long_date_style, rows = 2:11, cols = 1, gridExpand = TRUE)
## some custom date format examples
sty <- createStyle(numFmt = "yyyy/mm/dd hh:mm:ss AM/PM")
addStyle(wb, 1, style = sty, rows = 2:11, cols = 2, gridExpand = TRUE)
sty <- createStyle(numFmt = "hh:mm:ss AM/PM")
addStyle(wb, 1, style = sty, rows = 2:11, cols = 3, gridExpand = TRUE)
sty <- createStyle(numFmt = "hh:mm:ss")
addStyle(wb, 1, style = sty, rows = 2:11, cols = 4, gridExpand = TRUE)
setColWidths(wb, 1, cols = 1:4, widths = 30)
## The default date format used in writeData and writeDataTable can be set with:
options("openxlsx.datetimeFormat" = "yyyy/mm/dd hh:mm:ss")
writeData(wb, "DateTime Formatting", dateTimes, startRow = 8, borders = "rows")
options("openxlsx.datetimeFormat" = "hh:mm:ss AM/PM")
writeDataTable(wb, "DateTime Formatting", dateTimes, startRow = 15)
saveWorkbook(wb, "DateTime Formatting.xlsx", overwrite = TRUE)
openXL("DateTime Formatting.xlsx")
```
## Conditional Formatting
```{r include = TRUE, eval = FALSE, highlight = TRUE}
wb <- createWorkbook()
addWorksheet(wb, "cellIs")
addWorksheet(wb, "Moving Row")
addWorksheet(wb, "Moving Col")
addWorksheet(wb, "Dependent on 1")
addWorksheet(wb, "Duplicates")
addWorksheet(wb, "containsText")
addWorksheet(wb, "colourScale", zoom = 30)
addWorksheet(wb, "databar")
negStyle <- createStyle(fontColour = "#9C0006", bgFill = "#FFC7CE")
posStyle <- createStyle(fontColour = "#006100", bgFill = "#C6EFCE")
## rule applies to all each cell in range
writeData(wb, "cellIs", -5:5)
writeData(wb, "cellIs", LETTERS[1:11], startCol=2)
conditionalFormatting(wb, "cellIs", cols=1, rows=1:11, rule="!=0", style = negStyle)
conditionalFormatting(wb, "cellIs", cols=1, rows=1:11, rule="==0", style = posStyle)
## highlight row dependent on first cell in row
writeData(wb, "Moving Row", -5:5)
writeData(wb, "Moving Row", LETTERS[1:11], startCol=2)
conditionalFormatting(wb, "Moving Row", cols=1:2, rows=1:11, rule="$A1<0", style = negStyle)
conditionalFormatting(wb, "Moving Row", cols=1:2, rows=1:11, rule="$A1>0", style = posStyle)
## highlight column dependent on first cell in column
writeData(wb, "Moving Col", -5:5)
writeData(wb, "Moving Col", LETTERS[1:11], startCol=2)
conditionalFormatting(wb, "Moving Col", cols=1:2, rows=1:11, rule="A$1<0", style = negStyle)
conditionalFormatting(wb, "Moving Col", cols=1:2, rows=1:11, rule="A$1>0", style = posStyle)
## highlight entire range cols X rows dependent only on cell A1
writeData(wb, "Dependent on 1", -5:5)
writeData(wb, "Dependent on 1", LETTERS[1:11], startCol=2)
conditionalFormatting(wb, "Dependent on 1", cols=1:2, rows=1:11, rule="$A$1<0", style = negStyle)
conditionalFormatting(wb, "Dependent on 1", cols=1:2, rows=1:11, rule="$A$1>0", style = posStyle)
## highlight duplicates using default style
writeData(wb, "Duplicates", sample(LETTERS[1:15], size = 10, replace = TRUE))
conditionalFormatting(wb, "Duplicates", cols = 1, rows = 1:10, type = "duplicates")
## cells containing text
fn <- function(x) paste(sample(LETTERS, 10), collapse = "-")
writeData(wb, "containsText", sapply(1:10, fn))
conditionalFormatting(wb, "containsText", cols = 1, rows = 1:10, type = "contains", rule = "A")
## colourscale colours cells based on cell value
df <- read.xlsx(system.file("extdata", "readTest.xlsx", package = "openxlsx"), sheet = 5)
writeData(wb, "colourScale", df, colNames=FALSE) ## write data.frame
## rule is a vector or colours of length 2 or 3 (any hex colour or any of colours())
## If rule is NULL, min and max of cells is used. Rule must be the same length as style or NULL.
conditionalFormatting(wb, "colourScale", cols=seq_len(ncol(df)), rows=seq_len(nrow(df)),
style = c("black", "white"),
rule = c(0, 255),
type = "colourScale")
setColWidths(wb, "colourScale", cols = seq_len(ncol(df)), widths = 1.07)
setRowHeights(wb, "colourScale", rows = seq_len(nrow(df)), heights = 7.5)
## Databars
writeData(wb, "databar", -5:5)
conditionalFormatting(wb, "databar", cols = 1, rows = 1:12, type = "databar") ## Default colours
saveWorkbook(wb, "conditionalFormattingExample.xlsx", TRUE)
openXL(wb)
```
## Numeric Formatting
numeric columns styling can be set using the numFmt parameter in createStyle or a default can be
set with, for example, options("openxlsx.numFmt" = "#,#0.00")
```{r include = TRUE, eval = FALSE, highlight = TRUE}
options("openxlsx.numFmt" = NULL)
wb <- createWorkbook()
addWorksheet(wb, "Sheet 1")
df <- data.frame(matrix(12.987654321, ncol = 7, nrow = 5)) ## data.frame to write
df[ ,6:7] <- df[ ,6:7]*1E6
## Set column 1 class to "comma" to get comma separated thousands
class(df$X1) <- "comma"
writeData(wb, 1, df)
s <- createStyle(numFmt = "0.0")
addStyle(wb, 1, style = s, rows = 2:6, cols = 2, gridExpand = TRUE)
s <- createStyle(numFmt = "0.00")
addStyle(wb, 1, style = s, rows = 2:6, cols = 3, gridExpand = TRUE)
s <- createStyle(numFmt = "0.000")
addStyle(wb, 1, style = s, rows = 2:6, cols = 4, gridExpand = TRUE)
s <- createStyle(numFmt = "#,##0")
addStyle(wb, 1, style = s, rows = 2:6, cols = 5, gridExpand = TRUE)
s <- createStyle(numFmt = "#,##0.00")
addStyle(wb, 1, style = s, rows = 2:6, cols = 6, gridExpand = TRUE)
s <- createStyle(numFmt = "$ #,##0.00")
addStyle(wb, 1, style = s, rows = 2:6, cols = 7, gridExpand = TRUE)
## set a default number format for numeric columns of data.frames
options("openxlsx.numFmt" = "$* #,#0.00")
writeData(wb, 1, x = data.frame("Using Default Options" = rep(2345.1235, 5)), startCol = 9)
setColWidths(wb, 1, cols = 1:10, widths = 15)
## Using default numFmt to round to 2 dp (Any numeric column will be affected)
addWorksheet(wb, "Sheet 2")
df <- iris
df[, 1:4] <- df[1:4] + runif(1)
writeDataTable(wb, sheet = 2, x = df)
writeData(wb, sheet = 2, x = df, startCol = 7)
writeData(wb, sheet = 2, x = df, startCol = 13, borders = "rows")
## To stop auto-formatting numerics set
options("openxlsx.numFmt" = NULL)
addWorksheet(wb, "Sheet 3")
writeDataTable(wb, sheet = 3, x = df)
openXL(wb)
```
```{r cleanup, eval = FALSE, include = FALSE}
xlsx_files <- dir(pattern = "*.xlsx")
unlink(xlsx_files)
```
|
