1
2
3
4
5
6
7
8
9
10
11
12
13
14
15
16
17
18
19
20
21
22
23
24
25
26
27
28
29
30
31
32
33
34
35
36
37
38
39
40
41
42
43
44
45
46
47
48
49
50
51
52
53
54
55
56
57
58
59
60
61
62
63
64
65
66
67
68
69
70
71
72
73
74
|
# Using the debugger
You are launched into the debugger either by an `ebreak/sbreak` instruction, or when an exception occurs while running executing instructions.
Consider the example program `examples/fibs.asm`:
```asm riscv-asm
.data
fibs: .space 56
.text
main:
addi s1, zero, 0 ; storage index
addi s2, zero, 56 ; last storage index
addi t0, zero, 1 ; t0 = F_{i}
addi t1, zero, 1 ; t1 = F_{i+1}
ebreak ; launch debugger
loop:
sw t0, fibs(s1) ; save
add t2, t1, t0 ; t2 = F_{i+2}
addi t0, t1, 0 ; t0 = t1
addi t1, t2, 0 ; t1 = t2
addi s1, s1, 4 ; increment storage pointer
blt s1, s2, loop ; loop as long as we did not reach array length
ebreak ; launch debugger
; exit gracefully
addi a0, zero, 0
addi a7, zero, 93
scall ; exit with code 0
```
This calculates the fibonacci sequence and stores it in memory at `fibs`. before and after it calculated all fibonacci numbers, it
uses the `ebreak` instruction to open the debugger. Let's run it and see what happens:
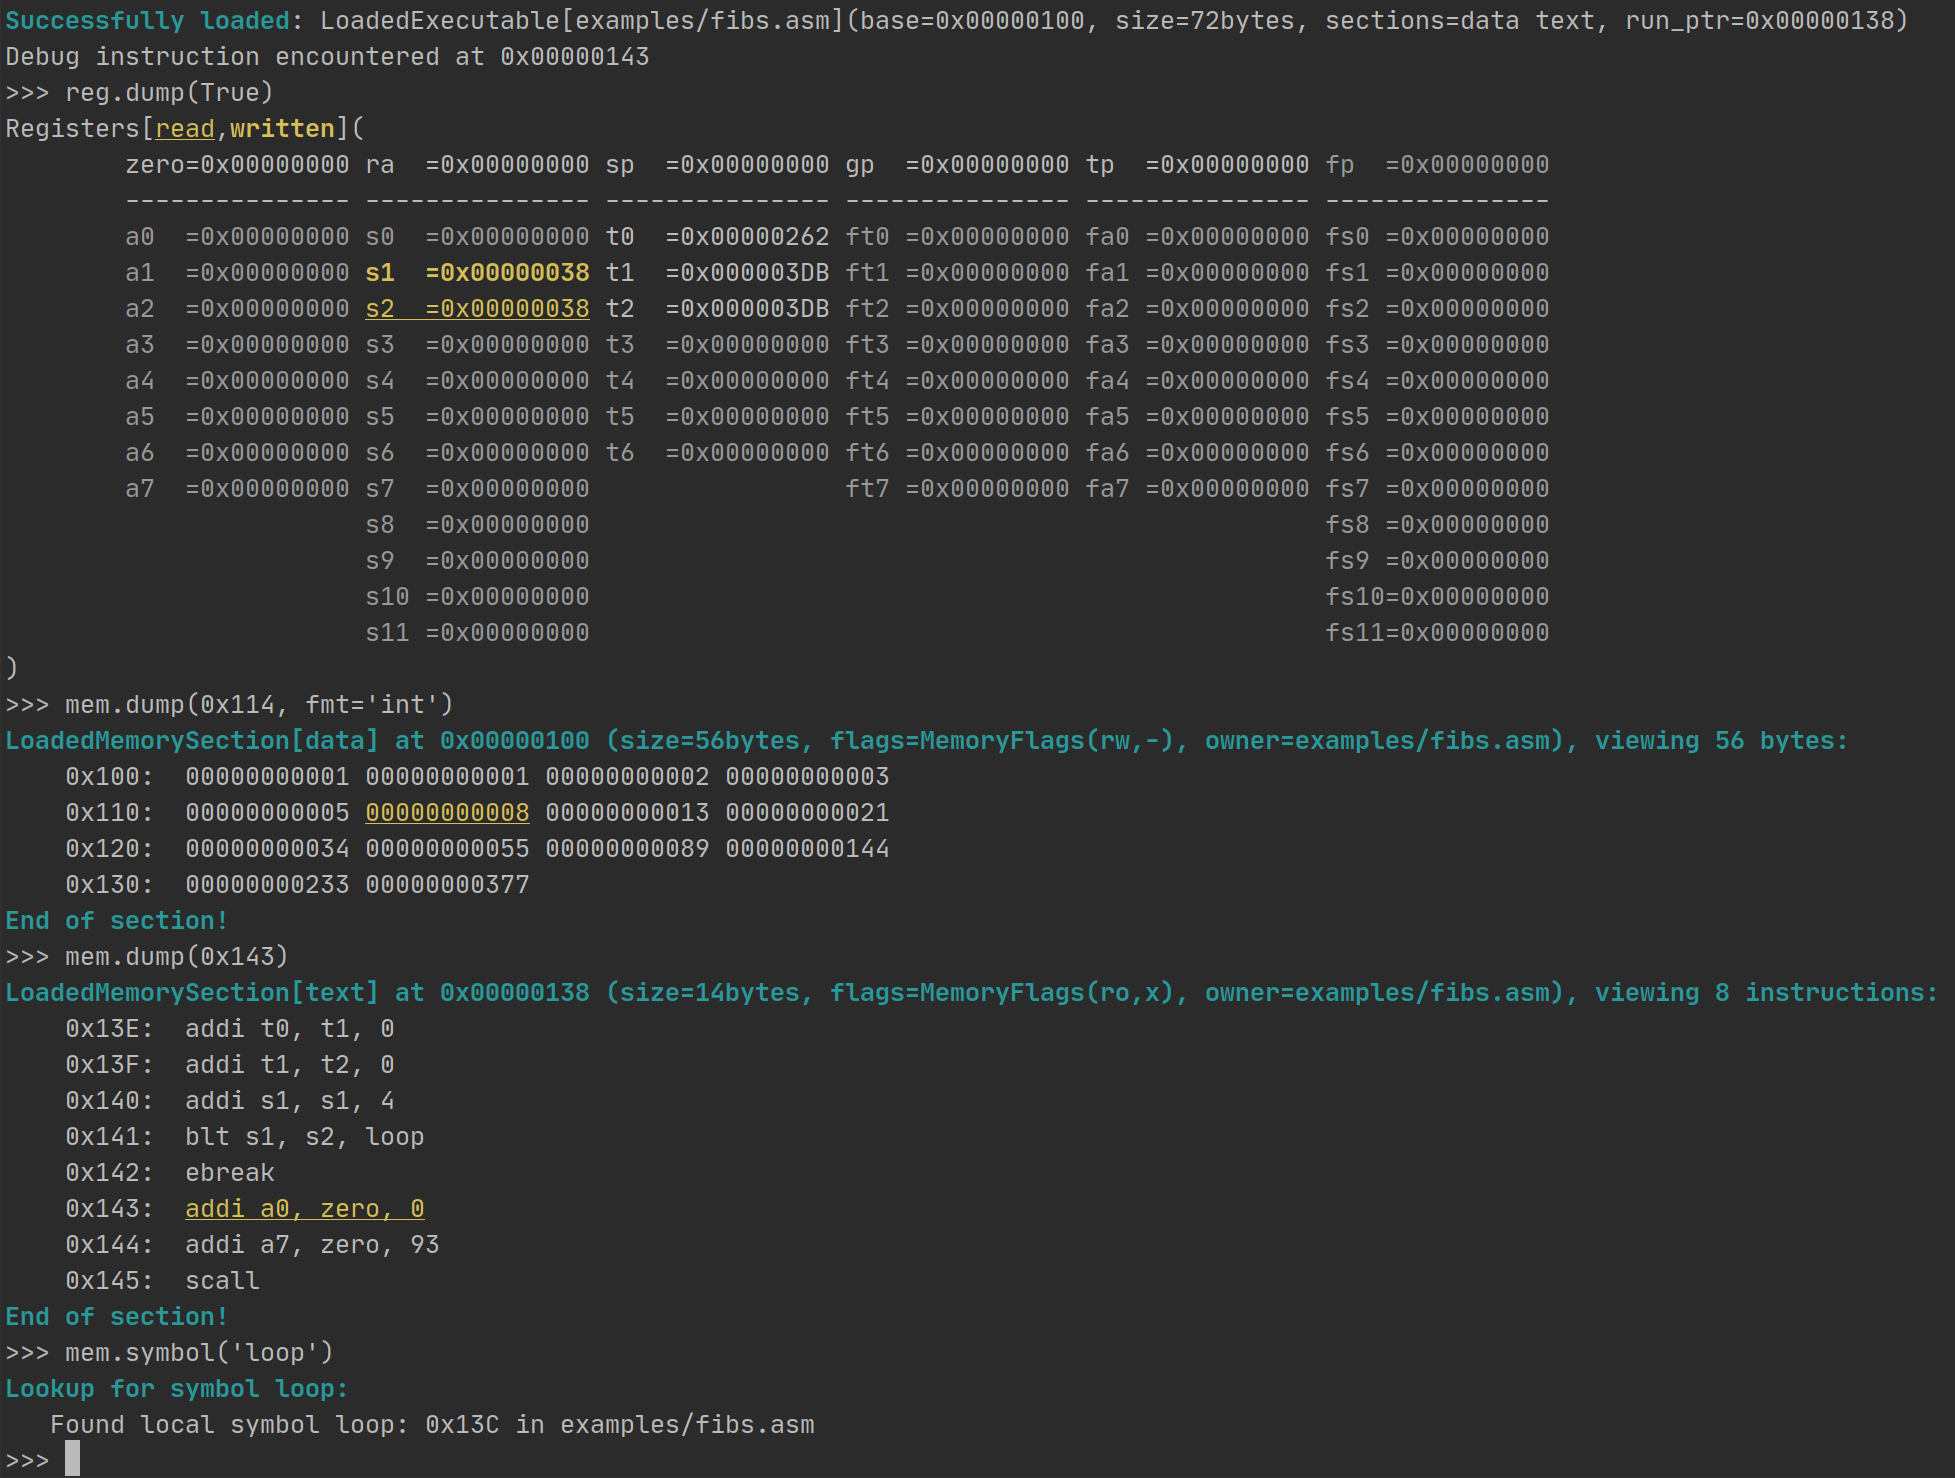
```
> python -m riscemu examples/fibs.asm
[MMU] Successfully loaded: LoadedExecutable[examples/fibs.asm](base=0x00000100, size=72bytes, sections=data text, run_ptr=0x00000138)
[CPU] Started running from 0x00000138 (examples/fibs.asm)
Debug instruction encountered at 0x0000013C
>>>
```
In this interactive session, you have access to the cpu, registers, memory and syscall interface. You can look into everything,
and most common tasks should have helper methods for them.
**Available objects are:**
* `mem`: (aka `mmu` or `memory`)
* `dump(address, fmt='hex', max_rows=10, group=4, bytes_per_row=16, all=False`:
Dumps the memory at `address`, in at most `max_rows` rows, each containing `bytes_per_row` bytes grouped
into groups of `group` bytes. They can be printed as:
* `hex`: hexadecimal, unsigned
* `int`: converted to integers
* `uint`: converted to unsigned integers
* `symbol(name)`: Lookup all symbols named `name`
* `reg`: (aka `regs` or `registers`)
* `dump(full=False)` dumps all integer registers (unless `all` is true, then all registers are printed)
* `get(name)` get register content
* `set(name, val)` set register content
* `cpu`:
* The CPU has the `pc` attribute and `cycle` attribute. Others won't be useful in this context.
**Available helpers are:**
* `dump(regs | addr)` dumps either registers or memory address
* `cont(verbose=False)` continue execution (verbose prints each executed instruction)
* `step()` run the next instruction
* `ins()` get current instruction (this reference is mutable, if you want to edit your code on the fly)
* `run_ins(name, *args)` Run an instruction in the current context. Symbols, jumping, etc are supported!
Example:
|
