1
2
3
4
5
6
7
8
9
10
11
12
13
14
15
16
17
18
19
20
21
22
23
24
25
26
27
28
29
30
31
32
33
34
35
36
37
38
39
40
41
42
43
44
45
46
47
48
49
50
51
52
53
54
55
56
57
58
59
60
61
62
63
64
65
66
67
68
69
70
71
72
73
74
75
76
77
78
79
80
81
82
83
84
85
86
87
88
89
90
91
92
93
94
95
96
97
98
99
100
101
102
103
104
105
106
107
108
109
110
111
112
113
114
115
116
117
118
119
120
121
122
123
124
125
126
127
128
129
130
131
132
133
134
135
136
137
138
139
140
141
142
143
144
145
146
147
148
149
150
151
152
153
154
155
156
157
158
159
160
161
162
163
164
165
166
167
168
169
170
171
172
173
174
175
176
177
178
179
180
181
182
183
184
185
186
187
188
189
190
191
192
193
|
# Using `perf` on Linux
One profiler supported by Wasmtime is the [`perf`
profiler](https://perf.wiki.kernel.org/index.php/Main_Page) for Linux. This is
an extremely powerful profiler with lots of documentation on the web, but for
the rest of this section we'll assume you're running on Linux and already have
`perf` installed.
There are two profiling agents for `perf`:
- a very simple one that will map code regions to symbol names: `perfmap`.
- a more detailed one that can provide additional information and mappings between the source
language statements and generated JIT code: `jitdump`.
## Profiling with `perfmap`
Simple profiling support with `perf` generates a "perf map" file that the `perf` CLI will
automatically look for, when running into unresolved symbols. This requires runtime support from
Wasmtime itself, so you will need to manually change a few things to enable profiling support in
your application. Enabling runtime support depends on how you're using Wasmtime:
* **Rust API** - you'll want to call the [`Config::profiler`] method with
`ProfilingStrategy::PerfMap` to enable profiling of your wasm modules.
* **C API** - you'll want to call the `wasmtime_config_profiler_set` API with a
`WASMTIME_PROFILING_STRATEGY_PERFMAP` value.
* **Command Line** - you'll want to pass the `--profile=perfmap` flag on the command
line.
Once perfmap support is enabled, you'll use `perf record` like usual to record
your application's performance.
For example if you're using the CLI, you'll execute:
```sh
$ perf record -k mono wasmtime --profile=perfmap foo.wasm
```
This will create a `perf.data` file as per usual, but it will *also* create a
`/tmp/perf-XXXX.map` file. This extra `.map` file is the perf map file which is
specified by `perf` and Wasmtime generates at runtime.
After that you can explore the `perf.data` profile as you usually would, for example with:
```sh
$ perf report --input perf.data
```
You should be able to see time spent in wasm functions, generate flamegraphs based on that, etc..
You should also see entries for wasm functions show up as one function and the name of each
function matches the debug name section in the wasm file.
Note that support for perfmap is still relatively new in Wasmtime, so if you
have any problems, please don't hesitate to [file an issue]!
[file an issue]: https://github.com/bytecodealliance/wasmtime/issues/new
## Profiling with `jitdump`
Profiling support with `perf` uses the "jitdump" support in the `perf` CLI. This
requires runtime support from Wasmtime itself, so you will need to manually
change a few things to enable profiling support in your application. First
you'll want to make sure that Wasmtime is compiled with the `jitdump` Cargo
feature (which is enabled by default). Otherwise enabling runtime support
depends on how you're using Wasmtime:
* **Rust API** - you'll want to call the [`Config::profiler`] method with
`ProfilingStrategy::JitDump` to enable profiling of your wasm modules.
* **C API** - you'll want to call the `wasmtime_config_profiler_set` API with a
`WASMTIME_PROFILING_STRATEGY_JITDUMP` value.
* **Command Line** - you'll want to pass the `--profile=jitdump` flag on the command
line.
Once jitdump support is enabled, you'll use `perf record` like usual to record
your application's performance. You'll need to also be sure to pass the
`--clockid mono` or `-k mono` flag to `perf record`.
For example if you're using the CLI, you'll execute:
```sh
$ perf record -k mono wasmtime --profile=jitdump foo.wasm
```
This will create a `perf.data` file as per usual, but it will *also* create a
`jit-XXXX.dump` file. This extra `*.dump` file is the jitdump file which is
specified by `perf` and Wasmtime generates at runtime.
The next thing you need to do is to merge the `*.dump` file into the
`perf.data` file, which you can do with the `perf inject` command:
```sh
$ perf inject --jit --input perf.data --output perf.jit.data
```
This will read `perf.data`, automatically pick up the `*.dump` file that's
correct, and then create `perf.jit.data` which merges all the JIT information
together. This should also create a lot of `jitted-XXXX-N.so` files in the
current directory which are ELF images for all the JIT functions that were
created by Wasmtime.
After that you can explore the `perf.jit.data` profile as you usually would,
for example with:
```sh
$ perf report --input perf.jit.data
```
You should be able to annotate wasm functions and see their raw assembly. You
should also see entries for wasm functions show up as one function and the
name of each function matches the debug name section in the wasm file.
Note that support for jitdump is still relatively new in Wasmtime, so if you
have any problems, please don't hesitate to [file an issue]!
[file an issue]: https://github.com/bytecodealliance/wasmtime/issues/new
### `perf` and DWARF information
If the jitdump profile doesn't give you enough information by default, you can
also enable dwarf debug information to be generated for JIT code which should
give the `perf` profiler more information about what's being profiled. This can
include information like more descriptive function names, filenames, and line
numbers.
Enabling dwarf debug information for JIT code depends on how you're using
Wasmtime:
* **Rust API** - you'll want to call the [`Config::debug_info`] method.
* **C API** - you'll want to call the `wasmtime_config_debug_info_set` API.
* **Command Line** - you'll want to pass the `-g` flag on the command line.
You shouldn't need to do anything else to get this information into `perf`. The
perf collection data should automatically pick up all this dwarf debug
information.
### `perf` example
Let's run through a quick example with `perf` to get the feel for things. First
let's take a look at some wasm:
```rust
fn main() {
let n = 42;
println!("fib({}) = {}", n, fib(n));
}
fn fib(n: u32) -> u32 {
if n <= 2 {
1
} else {
fib(n - 1) + fib(n - 2)
}
}
```
To collect perf information for this wasm module we'll execute:
```sh
$ rustc --target wasm32-wasip1 fib.rs -O
$ perf record -k mono wasmtime --profile=jitdump fib.wasm
fib(42) = 267914296
[ perf record: Woken up 1 times to write data ]
[ perf record: Captured and wrote 0.147 MB perf.data (3435 samples) ]
$ perf inject --jit --input perf.data --output perf.jit.data
```
And we should have all our information now! We can execute `perf report` for
example to see that 99% of our runtime (as expected) is spent in our `fib`
function. Note that the symbol has been demangled to `fib::fib` which is what
the Rust symbol is:
```sh
$ perf report --input perf.jit.data
```

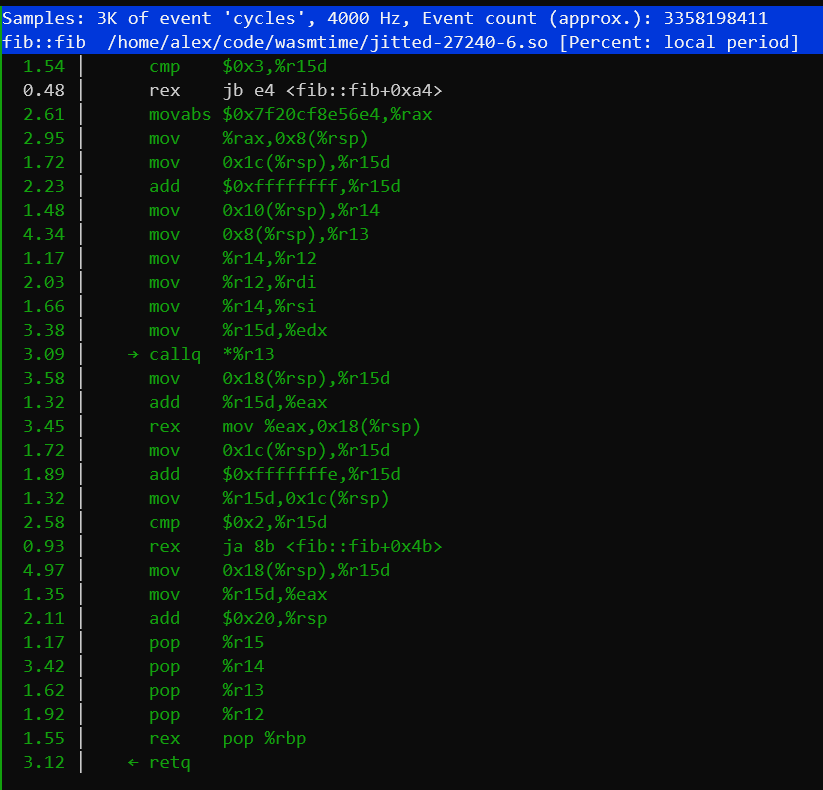
Alternatively we could also use `perf annotate` to take a look at the
disassembly of the `fib` function, seeing what the JIT generated:
```sh
$ perf annotate --input perf.jit.data
```
[`Config::debug_info`]: https://bytecodealliance.github.io/wasmtime/api/wasmtime/struct.Config.html#method.debug_info
|
