1
2
3
4
5
6
7
8
9
10
11
12
13
14
15
16
17
18
19
20
21
22
23
24
25
26
27
28
29
30
31
32
33
34
35
36
37
38
39
40
41
42
43
44
45
46
47
48
49
50
51
52
53
54
55
56
57
58
59
60
61
62
63
64
65
66
67
68
69
70
71
72
73
74
75
76
77
78
79
80
81
82
83
84
85
86
87
88
89
90
91
92
93
94
95
96
97
98
99
100
101
102
103
104
105
106
107
108
109
110
111
112
113
114
115
116
117
118
119
120
121
122
123
124
125
126
127
128
129
130
131
132
133
134
135
136
137
138
139
140
141
142
143
144
145
146
147
148
149
150
151
152
153
154
155
156
157
158
159
160
161
162
163
164
165
166
167
168
169
170
171
172
173
174
175
176
177
178
179
180
181
182
183
184
185
186
187
188
189
190
191
192
193
194
195
196
197
198
199
200
201
202
203
204
205
206
207
208
209
210
211
212
213
214
215
216
217
218
219
220
221
222
223
224
225
226
227
228
229
230
231
232
233
|
# Useful scripts
This folder contains scripts that may help ViSP user and developer.
## PerfCompare.py
Python script useful to compare benchmark performances before and after a potential source code modification/optimization or to compare performances using different third-party libraries.
For example in `$VISP_WS/visp-build/module/core` let us consider the `perfMatrixMultiplication` binary.
Depending on your python installation you may install support for enumerations:
```console
$ pip install enum
```
This script works like this:
- run first the performance binary activating benchmark and xml output options:
```console
$ cd $VISP_WS/visp-build/module/core
$ ./perfMatrixMultiplication --benchmark --reporter xml --out /tmp/log_perfMatrixMultiplication_MKL.xml
$ ./perfMatrixMultiplication --benchmark --reporter xml --out /tmp/log_perfMatrixMultiplication_OpenBLAS.xml
```
- Use the script to compare performances:
```console
$ cd $VISP_WS/visp/script
$ python PerfCompare.py --before /tmp/log_perfMatrixMultiplication_OpenBLAS.xml \
--after /tmp/log_perfMatrixMultiplication_MKL.xml \
--before-label OpenBLAS --after-label MKL
```
## create_module.py
This script allows to create the structure of a new ViSP module as explained in this [tutorial](https://visp-doc.inria.fr/doxygen/visp-daily/tutorial-contrib-module.html).
## format-coding-style.sh
This script uses `clang-format` to format ViSP source code. It should be used carefully since a lot of file could be affected.
- To install `clang-format`:
- On Ubuntu like OS:
```console
$ sudo apt-get install clang-format
```
- On OSX:
```console
$ brew install clang-format
```
- To run this script:
```console
$ cd $VISP_WS/visp/script
$ sh format-coding-style.sh
```
- To format a single file with extension `*.h` or `*.cpp`, you may rather run:
```console
$ cd $VISP_WS/visp
$ clang-format -i <path to file.[h,cpp]>
```
## make-coverage-report.sh
Script that runs the same coverage pipeline as the GitHub CI and generates an HTML report in the build folder. This makes it easier to have an up to date coverage when writing tests locally.
The script is working for Ubuntu and needs `lcov` tool.
- To install `lcov` on Ubuntu like OS:
```console
$ sudo apt-get install lcov gcovr
```
- To run the script
```console
$ cd $VISP_WS
$ git clone https://github.com/lagadic/visp
$ ./visp/script/make-coverage-report.sh visp-build
```
- Results are available in `visp-build/coverage/index.html`.
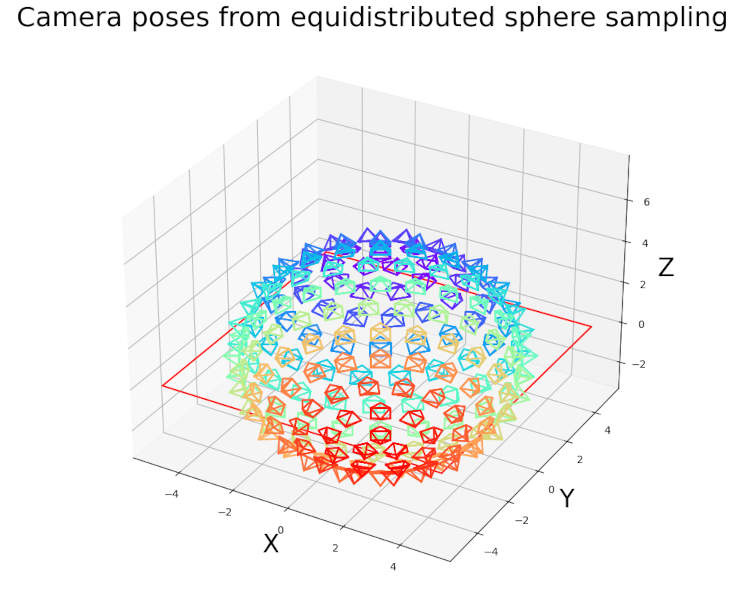
## LonLatCamPosesVisualizer.py
This Python script allows displaying camera poses sampled from longitude / latitude coordinates and using a method for regularly sampled points on a sphere.
Example (use the help option `-h` to display the available parameters):
```console
python3 LonLatCamPosesVisualizer.py --full-sphere
```
Following image shows camera poses equidistributed sampled on a sphere:
## Blender/look_at.py
This Python script can be used in a Blender scene and contains example code for:
- camera look-at function, to automatically point the camera toward a specific object,
- retrieving the camera pose with respect to another Blender object,
- and save camera images in a `/tmp/` directory.
To test this script:
- on Ubuntu/Linux launch Blender from a Terminal and use the default scene,
- switch to the [Text Editor](https://docs.blender.org/manual/en/dev/editors/text_editor.html) and open the Python script,
- when running the script, you should see the corresponding camera poses outputed on the terminal.
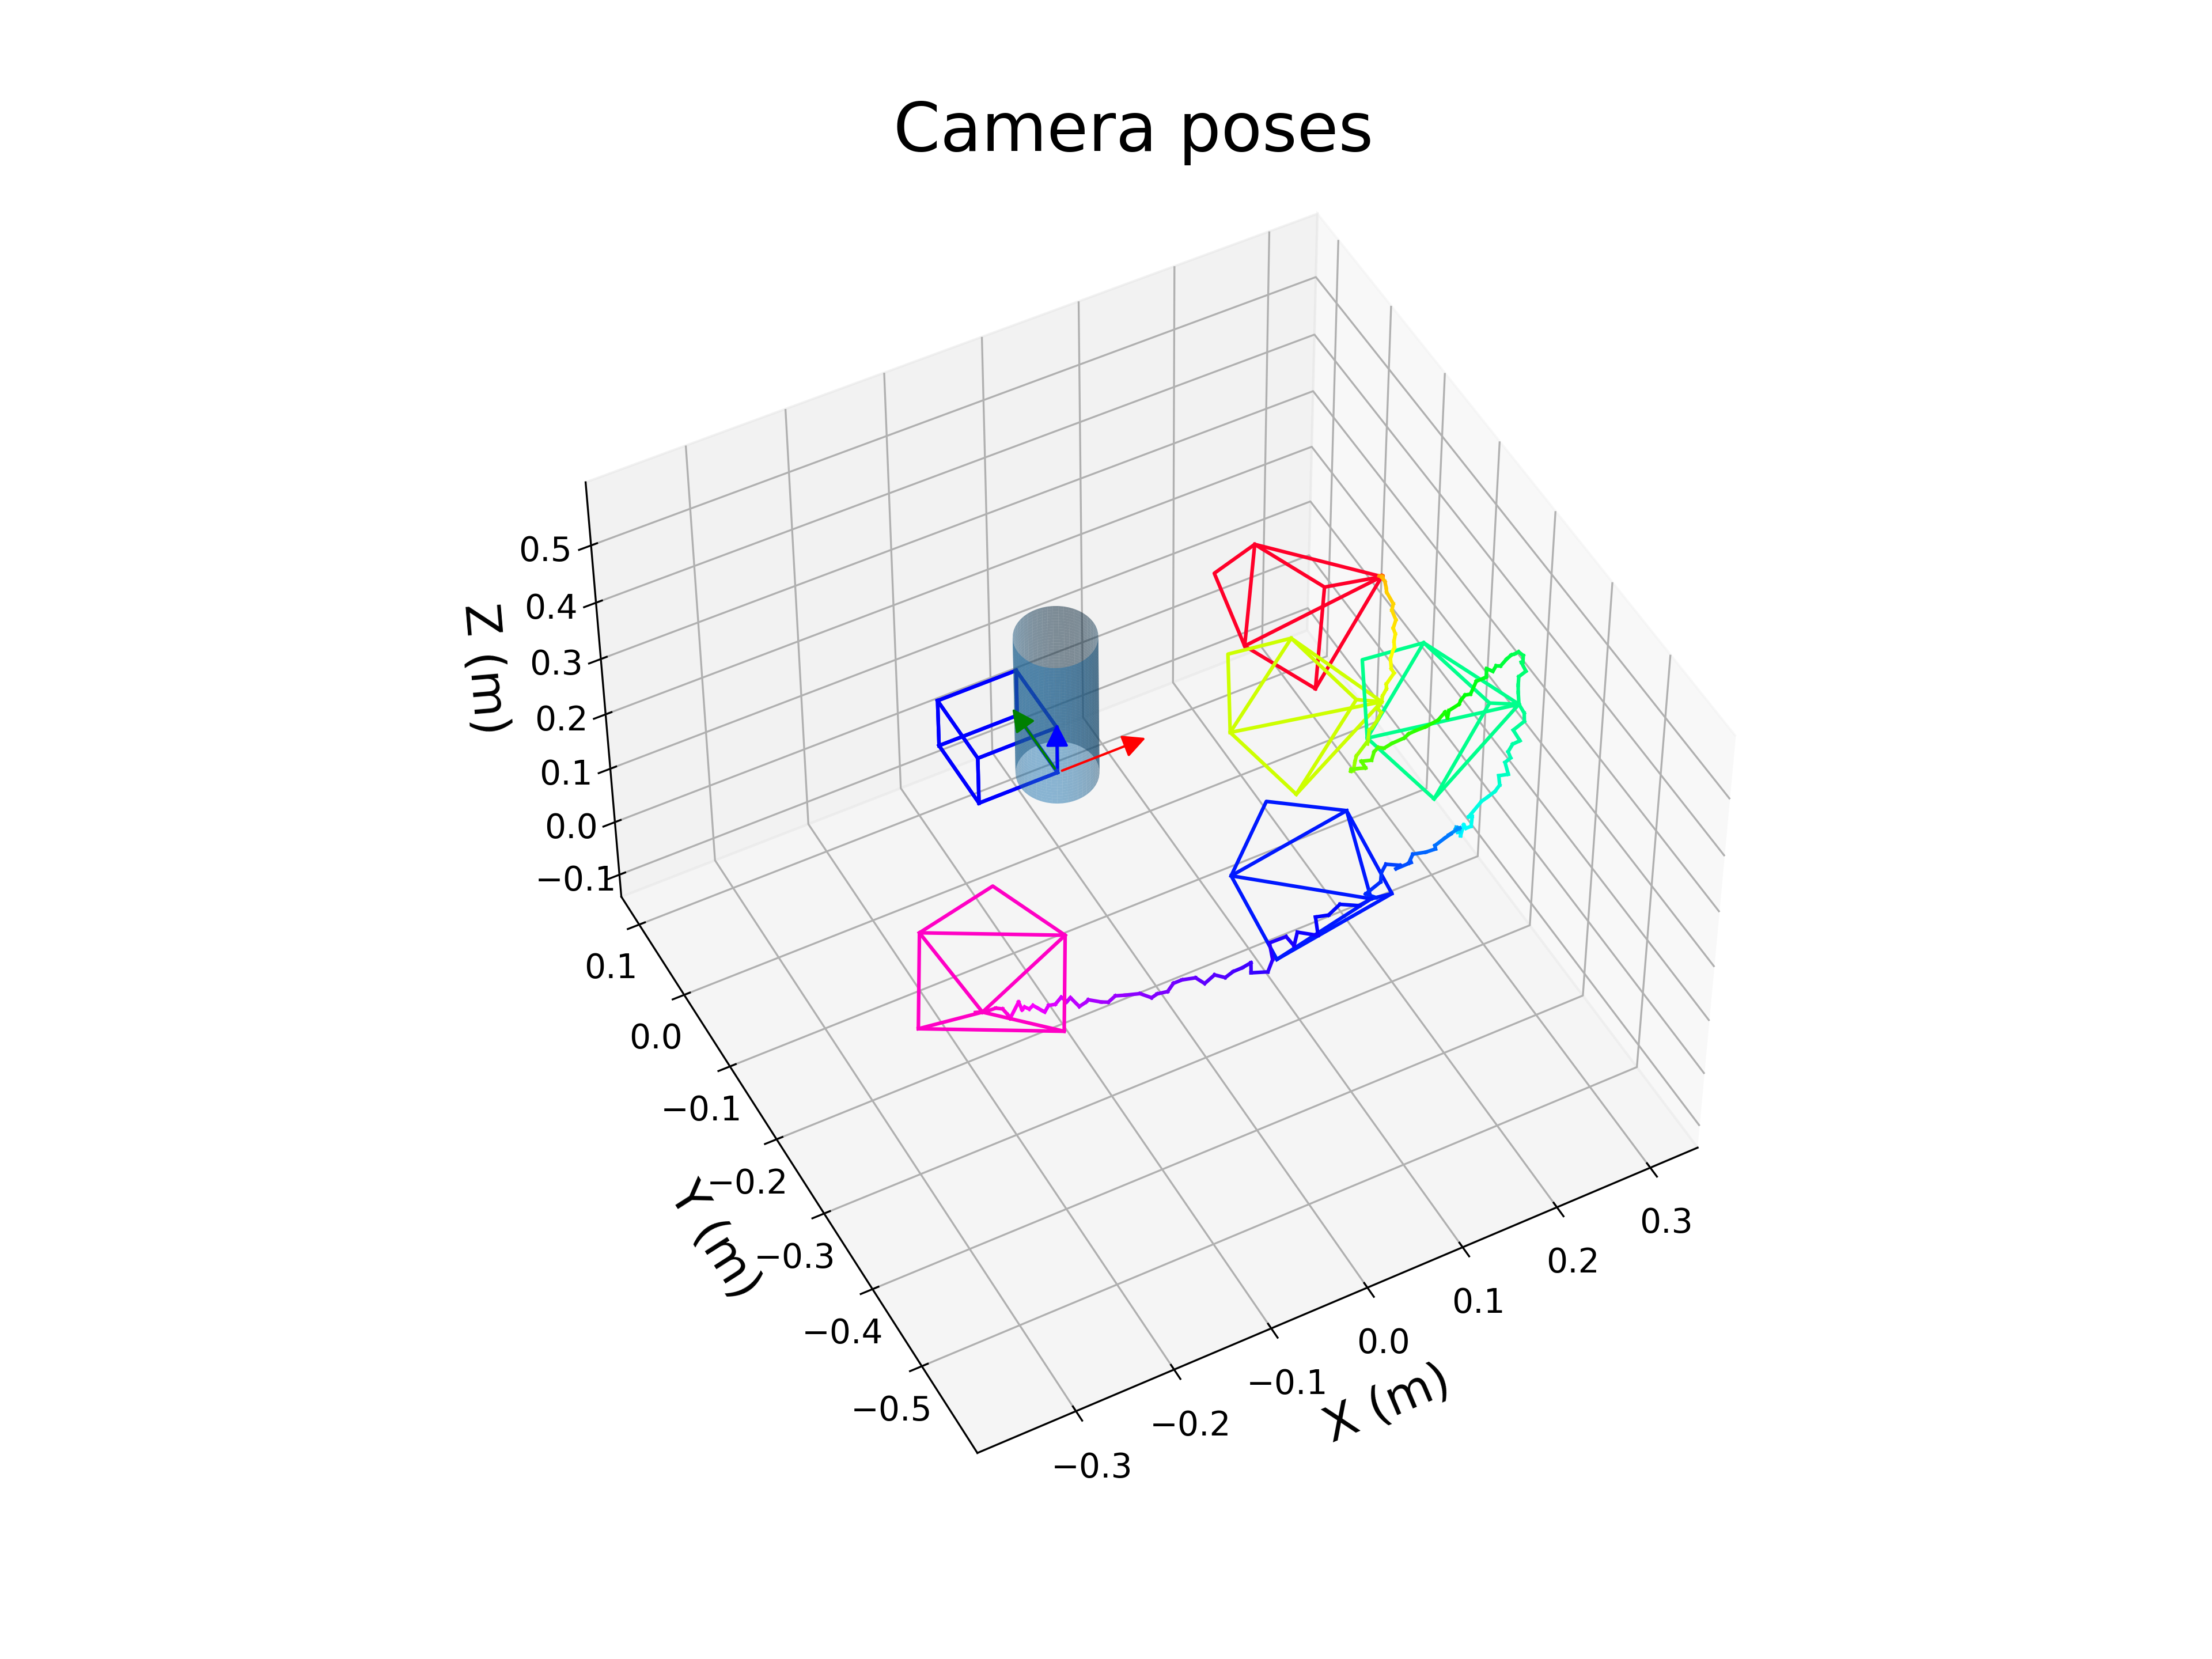
## PlotCameraTrajectory.py
This Python script allows displaying camera poses along with the object of interest.
Camera poses can be saved in `4x4` homogeneous matrix form or in `1x6` pose vector form (`[tx, ty, tz, tux, tuy, tuz]`).
C++ example code using the `4x4` homogeneous matrix format:
```cpp
std::ofstream file_pose("poses.txt", std::ios_base::app);
if (file_pose.is_open()) {
for (unsigned int i = 0; i < 4; i++) {
for (unsigned int j = 0; j < 4; j++) {
file_pose << c1Mo[i][j] << " ";
}
file_pose << std::endl;
}
}
```
Camera poses can also be read from npz file format:
- pass the `--npz` flag to indicate the input pose file is stored in npz file format
- the script will read data from `vec_poses` array name
- array should contains `{tx, ty, tz, tu.x, tu.y, tu.z}` information (`nb_poses x 6`)
Script example (use the help option `-h` to display the available parameters):
```console
python3 PlotCameraTrajectory.py -p poses.txt -m cube_and_cylinder.cao --azim -118 --elev 48 --x-lim -0.384455412421155 0.336083836255455 --y-lim -0.595371140756035 0.12516810792057498 --z-lim -0.12739950848021997 0.59313974019639 --num-cam 4 --save --save-pattern 'image_{:04d}.png' --frame-size 0.1
```
Following video shows the camera poses outputed by the ViSP model-based tracker when tracking the cube+cylinder object model:
[](https://user-images.githubusercontent.com/8035162/180662750-02fccaff-74bd-411c-8258-06910edc6fde.mp4 "Cube+cylinder tracking using ViSP MBT")
- Full tracking pipeline using teabox example:
1. Save teabox poses in npz format
```console
% cd $VISP_WS/visp-build/tutorial/tracking/model-based/generic
% ./tutorial-mb-generic-tracker-full \
--video model/teabox/teabox.mp4 \
--model model/teabox/teabox.cao \
--tracker 2 \
--save-results teabox_tracking_results.npz
```
2. Visualize camera trajectories
```console
% cd $VISP_WS/visp/script
% python3 -m venv venv
% source venv/bin/activate
% python3 -m pip install matplotlib
% python3 PlotCameraTrajectory.py \
-p ../../visp-build/tutorial/tracking/model-based/generic/teabox_tracking_results.npz \
--npz \
-m ../../visp-build/tutorial/tracking/model-based/generic/model/teabox/teabox.cao
```
- Full tracking pipeline using cube example:
1. Save cube poses in npz format
```console
% cd $VISP_WS/visp-build/tutorial/tracking/model-based/generic
% ./tutorial-mb-generic-tracker-full \
--video $VISP_WS/visp-images/mbt/cube/image%04d.png \
--model $VISP_WS/visp-images/mbt/cube.cao \
--tracker 2 \
--save-results cube_tracking_results.npz
```
2. Visualize camera trajectories
```console
% cd $VISP_WS/visp/script
% python3 -m venv venv
% source venv/bin/activate
% python3 -m pip install matplotlib
% python3 PlotCameraTrajectory.py \
-p ../../visp-build/tutorial/tracking/model-based/generic/cube_tracking_results.npz \
--npz \
-m $VISP_WS/visp-images/mbt/cube.cao
```
- Full tracking pipeline using cube & cylinder example:
1. Save cube & cylinder poses in npz format
```console
% cd $VISP_WS/visp-build/tutorial/tracking/model-based/generic
% ./tutorial-mb-generic-tracker-full \
--video $VISP_WS/visp-images/mbt/cube/image%04d.png \
--model $VISP_WS/visp-images/mbt/cube_and_cylinder.cao \
--tracker 2 \
--save-results cube_and_cylinder_tracking_results.npz
```
2. Visualize camera trajectories
```console
% cd $VISP_WS/visp/script
% python3 -m venv venv
% source venv/bin/activate
% python3 -m pip install matplotlib
% python3 PlotCameraTrajectory.py \
-p ../../visp-build/tutorial/tracking/model-based/generic/cube_and_cylinder_tracking_results.npz \
--npz \
-m $VISP_WS/visp-images/mbt/cube_and_cylinder.cao
```
## PlotRGBIrDepthData.py
This Python script allows displaying RGB/Infrared/Depth/Pointcloud data saved using the
`apps/rs-dataset/visp-save-rs-dataset.cpp` app.
It contains sample code to learn how to manipulate NumPy NPZ format, such as multi-dimensional array and display them with Matplotlib.
Simply run the following command with the correct folder path:
```console
python3 PlotRGBIrDepthData.py -i <folder>
```
|
