1
2
3
4
5
6
7
8
9
10
11
12
13
14
15
16
17
18
19
20
21
22
23
24
25
26
27
28
29
30
31
32
33
34
35
36
37
38
39
40
41
42
43
44
45
46
47
48
49
50
51
52
53
54
55
56
57
58
59
60
61
62
63
64
65
66
67
68
69
70
71
72
73
74
75
76
77
78
79
80
81
82
83
84
85
86
87
88
89
90
91
92
93
94
95
96
97
98
99
100
101
102
103
104
105
106
107
108
109
110
111
112
113
114
115
116
117
118
119
120
121
122
123
124
125
126
127
128
129
130
131
132
133
134
135
136
137
138
139
140
141
142
143
144
145
|
About _xdot.py_
=================
_xdot.py_ is an interactive viewer for graphs written in [Graphviz](http://www.graphviz.org/)'s [dot language](http://www.graphviz.org/doc/info/lang.html).
It uses internally the GraphViz's [xdot output format](http://www.graphviz.org/doc/info/output.html#d:xdot) as an intermediate format, [Python GTK bindings](https://pygobject.readthedocs.io), and [Cairo](https://cairographics.org/) for rendering.
_xdot.py_ can be used either as a standalone application from command line, or as a library embedded in your Python application.
Status
======
_xdot.py_ script became much more popular than I ever anticipated, and there are several interested in improving it further. However, for several years now, _xdot.py_ already meets my own needs, and unfortunately I don't have much time for maintaining it myself.
So I'm looking into transition _xdot.py_ maintenance to [others](https://github.com/jrfonseca/xdot.py/wiki/Forks): either hand over the maintenance _xdot.py_ to a community or indicate an official fork of _xdot.py_.
I encourage people interested in development of _xdot.py_ to fork the [GitHub repository](https://github.com/jrfonseca/xdot.py), and join the new [mailing list](https://groups.google.com/d/forum/xdot-py).
Features
========
* Since it doesn't use bitmaps it is fast and has a small memory footprint.
* Arbitrary zoom.
* Keyboard/mouse navigation.
* Supports events on the nodes with URLs.
* Animated jumping between nodes.
* Highlights node/edge under mouse.
Known Issues
============
* Not all xdot attributes are supported or correctly rendered yet. It works well for my applications but YMMV.
* Text doesn't scale properly to large sizes if font hinting is enabled. I haven't found a reliable way to disable font hinting during rendering yet.
See also:
* [github issue tracker](https://github.com/jrfonseca/xdot.py/issues)
Screenshots
===========
[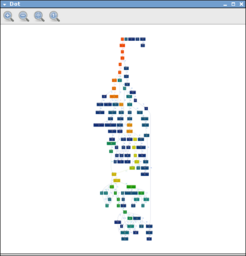](https://raw.github.com/wiki/jrfonseca/xdot.py/xdot-profile1.png)
[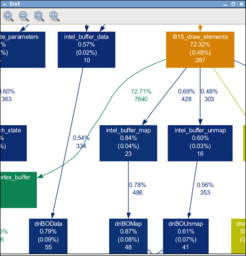](https://raw.github.com/wiki/jrfonseca/xdot.py/xdot-profile2.png)
[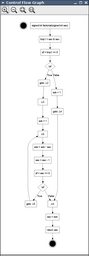](https://raw.github.com/wiki/jrfonseca/xdot.py/xdot-cfg.png)
Requirements
============
* [Python 3](https://www.python.org/download/)
* [PyGObject bindings for GTK3](https://pygobject.readthedocs.io)
* [NumPy](https://numpy.org/)
* [Graphviz](https://graphviz.org/download/)
Windows users
-------------
Download and install:
* [Python for Windows](https://www.python.org/downloads/windows/)
* [PyGObject bindings for GTK3](https://pygobject.readthedocs.io/en/latest/getting_started.html#windows-getting-started)
* `pip install numpy`
* [Graphviz for Windows](https://graphviz.org/download/)
Debian/Ubuntu users
-------------------
Run:
apt install gir1.2-gtk-3.0 python3-gi python3-gi-cairo python3-numpy graphviz
Usage
=====
Command Line
------------
If you install _xdot.py_ from PyPI or from your Linux distribution package managing system, you should have the `xdot` somewhere in your `PATH` automatically.
When running _xdot.py_ from its source tree, you can run it by first setting `PYTHONPATH` environment variable to the full path of _xdot.py_'s source tree, then running:
python3 -m xdot
You can also pass the following options:
Usage:
xdot.py [file|-]
Options:
-h, --help show this help message and exit
-f FILTER, --filter=FILTER
graphviz filter: dot, neato, twopi, circo, or fdp
[default: dot]
-n, --no-filter assume input is already filtered into xdot format (use
e.g. dot -Txdot)
-g GEOMETRY default window size in form WxH
Shortcuts:
Up, Down, Left, Right scroll
PageUp, +, = zoom in
PageDown, - zoom out
R reload dot file
F find
Q quit
P print
T toggle toolbar
W zoom to fit
Escape halt animation
Ctrl-drag zoom in/out
Shift-drag zooms an area
Click (on edge) focus edge's source node
Ctrl-click (on edge) focus edge's *destination* node
If `-` is given as input file then _xdot.py_ will read the dot graph from the standard input.
Embedding
---------
See included `sample.py` script for an example of how to embedded _xdot.py_ into another application.
[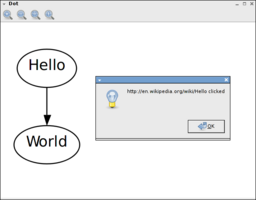](https://raw.github.com/wiki/jrfonseca/xdot.py/xdot-sample.png)
Download
========
* https://pypi.python.org/pypi/xdot
* https://github.com/jrfonseca/xdot.py
Links
=====
* [Graphviz homepage](http://www.graphviz.org/)
* [ZGRViewer](http://zvtm.sourceforge.net/zgrviewer.html) -- another superb graphviz/dot viewer
* [dot2tex](https://github.com/kjellmf/dot2tex) -- python script to convert xdot output from Graphviz to a series of PSTricks or PGF/TikZ commands.
* The [PyPy project](http://pypy.org/) also includes an [interactive dot viewer based on graphviz's plain format and the pygame library](https://morepypy.blogspot.com/2008/01/visualizing-python-tokenizer.html).
|
